
This article was submitted by a Guest Contributor.
The Department of Statistics (SingStat) released a report earlier this year detailing how personal disposable income and personal savings have changed since 1980.
This report is full of insights into the consumption and saving behaviour of everyday Singaporeans. Here are 4 key takeaways.
What is Personal Disposable Income and Personal Savings?
First, let’s define three key terms:
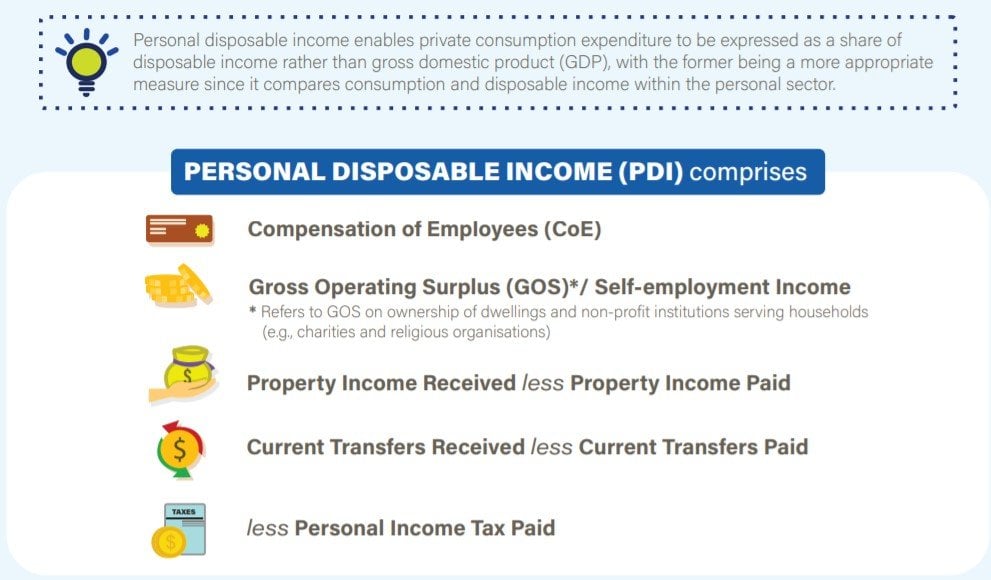
- Personal Disposable Income (PDI) measures the income after accounting for net property income received, net current transfers received and personal income tax paid.
- Private Consumption Expenditure (PCE) measures the spending on goods and services
- Private Savings (PS) is the difference between PDI and PCE (i.e. disposable income not consumed)
Personal Disposable Income has slowed since the 1980s.
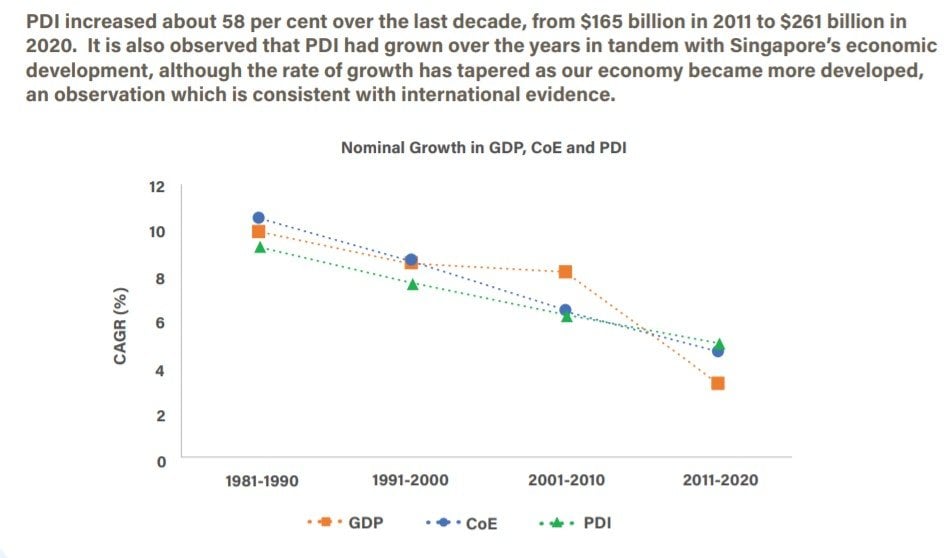
This chart measures the compound annual growth rate (CAGR) of three metrics: GDP, Compensation of Employees (i.e. salary) and Personal Disposable Income (PDI), over ten-year periods.
The CAGR of PDI has steadily declined in each successive period. It went from 9.2% during 1981-1990 to 5.2% during 2011-2020. Nominally, PDI grew from $165 billion in 2011 to $261 billion in 2020.
Seen in isolation, this downward trend seems concerning. However, this decline is also experienced by other advanced economies internationally – PDI growth rates tend to taper as the economy matures.
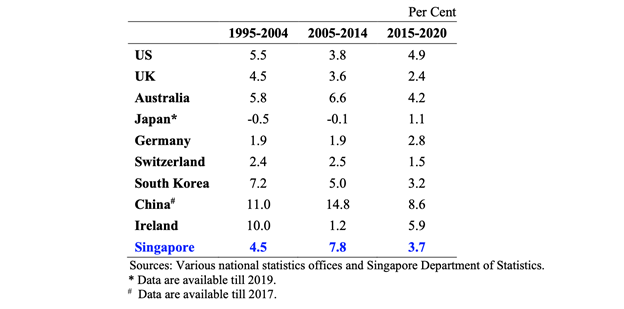
This table compares the growth of PDI in advanced economies since 1995. Singapore’s growth in PDI from 2015–2020 was 3.7%. This is comparable to other countries like South Korea and Australia, which were at 3.2% and 4.2% respectively.
A similar story is playing out in China too. China’s PDI enjoyed double-digit growth along with their GDP from the 1990s to early 2010s. However, as their economy begins to mature and growth slows, growth in PDI has also dropped to 8.6% the last five years.
Personal Savings spiked during the first wave of Covid-19
Savings hit a record-high in Q2 2020, as the impact of Covid-19 started to be felt across the world. To measure this, the table below looks at the change in Personal Savings Rate (PSR), which is personal savings (PS) as a percentage of PDI.
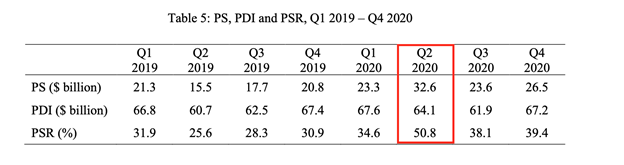
PSR spiked from 34.6% in Q1 2020 to 50.8% the next quarter. Much of this is due to the sharp drop in Private Consumption Expenditure, which fell as much as 30.1%. People spent much less as they were confined to homes during the circuit breaker, with almost all shops shuttered.
The report describes the 30.1% decline in PCE in Q2 2020 the “worst ever contraction on record”.
Spending in areas such as shopping, transport, F&B and recreational activities, were the hardest hit, falling more than 50% year-on-year.
Personal Savings also spiked during other recessions
History doesn’t repeat itself, but it often rhymes. Looking back at how the personal savings rate (PSR) changed during past recessions reveals a similar trend.
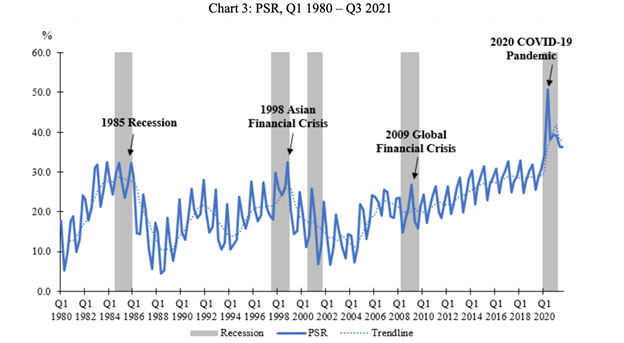
PSR peaked in the four major recessions Singapore experienced — the 1985 Recession, 1998 Asian Financial Crisis, 2009 Global Financial Crisis and 2020 pandemic. This reflects households’ precautionary savings in response to economic or medical uncertainty.
There are many reasons why savings go up. For instance, one is more likely to hold off on major expenses like a big holiday, and cut back on dining out and shopping if they were worried about getting laid-off.
PDI was supported by strong fiscal stimulus package
The government had an unprecedented fiscal response to Covid-19. The Solidarity Budget (where 90% of Singaporeans received a $600 payout) was one example of the $100 billion – almost 20% of the GDP – spent to stimulate the economy.
This table shows the impact those policies had on personal disposable income.
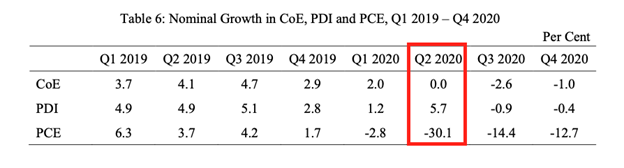
Compensation of Employees (CoE) in Q2 2020 was totally flat, the lowest since 2004. This was the result of a decline in employment because of the pandemic. But considering how many industries were affected – from tourism to F&B – it likely would have been much worse without substantial wage subsidies to help companies keep employees on the payroll.
Conclusion
SingStat’s full report is well worth a read if you want to dive deeper into the data. Just two metrics – Personal Disposable Income and Personal Savings – can reveal a lot about the behaviour of Singaporeans.
This article was submitted by a Guest Contributor.