
Following my previous articles on StashAway and Autowealth, a number of readers have asked me to do a review on Smartly and OCBC RoboInvest. My response was always the same: I’ve said my piece on robo advisors. If you’re picking between active managed funds such as unit trusts or investment linked products, robo advisors are a great choice. But if you’re able to enter a couple of buy orders every quarter and invest yourself, then you could easily pocket the fees charged (around 0.5% to 1.0% AUM per annum), and achieve about the same returns as a robo advisor.
And then I read this article from the Business Times:
OCBC Bank has launched a robo-investment service for its account holders, using technology developed by Singapore-based fintech startup WeInvest.
The launch of OCBC RoboInvest follows a pilot run with selected accredited investors last year.
Investors are required to make a minimum initial investment of S$3,500.
A 1.5 per cent annual fee will be charged for assets under management (AUM) of up to S$50,000. For AUMs above S$50,000, the AUM fee is one per cent per annum.
Other exchange fees and charges apply, which vary depending on the markets and trading channels used to execute the orders.
Investors can choose from 28 investment portfolios of equities and exchange traded funds (ETFs) across six markets – Singapore, Australia, the UK, the US, Europe and Hong Kong.
1.5% annual fee? Either OCBC has invented the artificial intelligence, machine learning version of Warren Buffett, or you know… there was a typo? Right there and then, I knew I had to do a follow up article to review OCBC RoboInvest. And while I was at it, I might as well take to chance to review all the robo advisors in Singapore.
Basics: What is a Robo Advisor?
Regular readers of Financial Horse should be familiar with the concept of a robo advisor. Basically, you fill in a bunch of questions on your financial goals, your risk profile, your savings rate etc. The robo advisor generates a recommended asset allocation based off your answer. You transfer in a lump sum, make monthly payments, and the robo advisor makes regular purchases and rebalancing, for a small percentage based fee.
For this article, I wanted to compare all the main robo advisors available to Singapore retail investors today, namely:
- OCBC RoboInvest (Powered by WeInvest)
- StashAway
- Autowealth
- Smartly
- UTrade Robo
- CGS CIMB eWealth Robo
Backtested Returns
For the backtested returns, I used 2 specific test cases:
- Aggressive Portfolio – This assumes a 30 year old investor, who has S$100,000 to invest upfront, and is able to add S$1,000 for investments monthly. His goal is to grow his net worth aggressively, and to take on the maximum risk profile the robo advisor would allow him.
- Balanced Portfolio – This assumes a 30 year old investor, who has S$100,000 to invest upfront, and is able to add S$1,000 for investments monthly. His goal is to grow his net worth, but he is relatively risk adverse and has a strong focus on limiting downside. Accordingly, he picks the medium risk profile available to him.
There were a couple of assumptions made when backtesting:
- All dividends / distributions are reinvested. This is similar to what the robo advisors do.
- All the robo advisors require that a small proportion of assets (about 1%) be kept in cash, to pay for their fees. For backtesting purposes, I allocated this cash amount into a US stock ETF.
- All backtested returns are before accounting for fees to the robo advisor. Because of reasons 2 and 3, the real world returns will not exactly match the returns here.
- I’m pretty sure after this article I’m going to get a nasty email saying that my numbers aren’t accurate for some reason. So please note the express disclaimer below:
The information contained in this article has not been independently verified. No representation or warranty expressed or implied is made as to, and no reliance should be placed on, the fairness, accuracy, completeness or correctness of the information or opinions contained in this article. Neither Financial Horse or any of its affiliates, advisers or representatives shall have any liability whatsoever (in negligence or otherwise) for any loss howsoever arising, whether directly or indirectly, from any use, reliance or distribution of this article or its contents or otherwise arising in connection with this presentation. The past performance of the Robo Advisors is not indicative of their future performance.
Aggressive Portfolio
Step 1
Because the robo advisors used certain ETFs that do not go beyond 2011, I backtested all 6 robo advisors from January 2011 to August 2018, for the first part of the test. These are the results:
| Position | Robo Advisor | Annualised Returns |
| (1) | Stashaway | 11.61% |
| (2) | CGS CIMB eWealth Robo | 10.19% |
| (3) | OCBC RoboInvest (Aggressive Portfolio) | 8.64% |
| (4) | Autowealth | 8.0% |
| (5) | Smartly | 6.97% |
| (6) | UTrade Robo (UOB Robo) | 5.63% |
Step 2
I then benchmarked the top 3 robo advisors against each other, as far back as they would go. Here are the results (Portfolio 1 is StashAway, Portfolio 2 is CGS CIMB eWealth Robo, Portfolio 3 is OCBC RoboInvest).
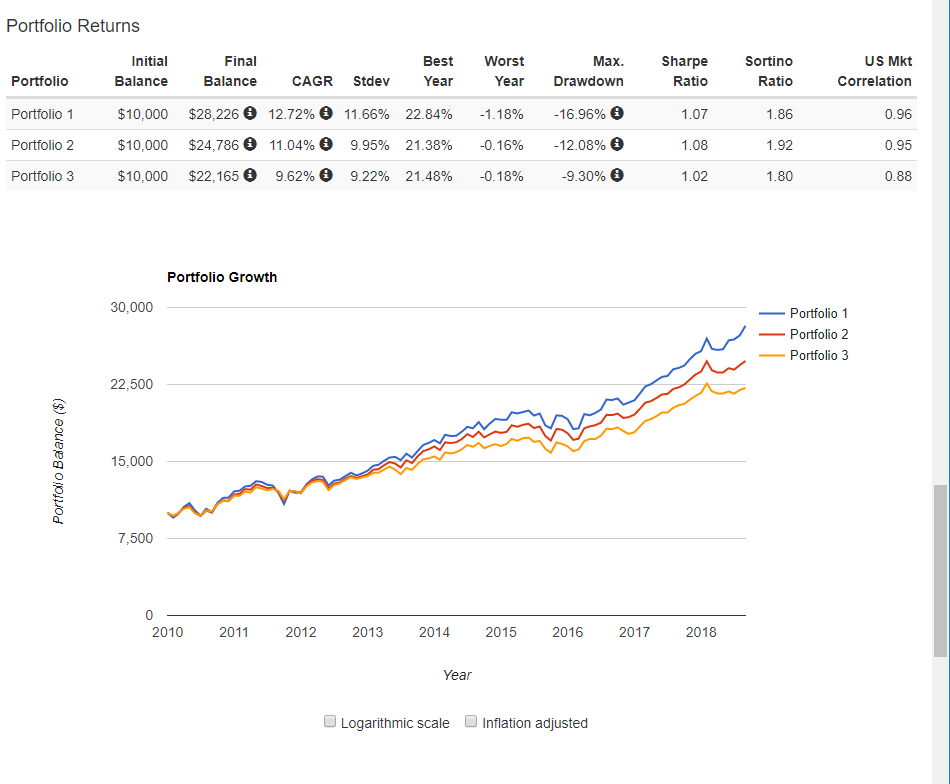
The results were very clear, for the aggressive portfolio, StashAway is by far the best robo advisor. CGS CIMB eWealth Robo came in at quite a decent second place, but it still underperformed StashAway by a fair bit.
Balanced Portfolio
Step 1
For the balanced portfolio, I backtested all 6 robo advisors from 2011 to 2018, for the first part of the testing (some ETFs picked by the robos don’t go beyond 2011, hence I had to start from there):
| Position | Robo Advisor | Annualised Returns |
| (1) | CGS CIMB eWealth Robo | 7.87% |
| (2) | Smartly | 7.57% |
| (3) | OCBC RoboInvest (Balanced Portfolio) | 7.31% |
| (4) | StashAway | 6.59% |
| (5) | UTrade Robo (UOB Robo) | 5.33% |
| (6) | Autowealth | 5.30% |
Step 2
I then benchmarked the top 3 robo advisors against each other, as far back as they would go. The results are below (Portfolio 1 is CGS CIMB eWealth Robo, Portfolio 2 is OCBC RoboInvest (Balanced Portfolio), Portfolio 3 is Smartly):
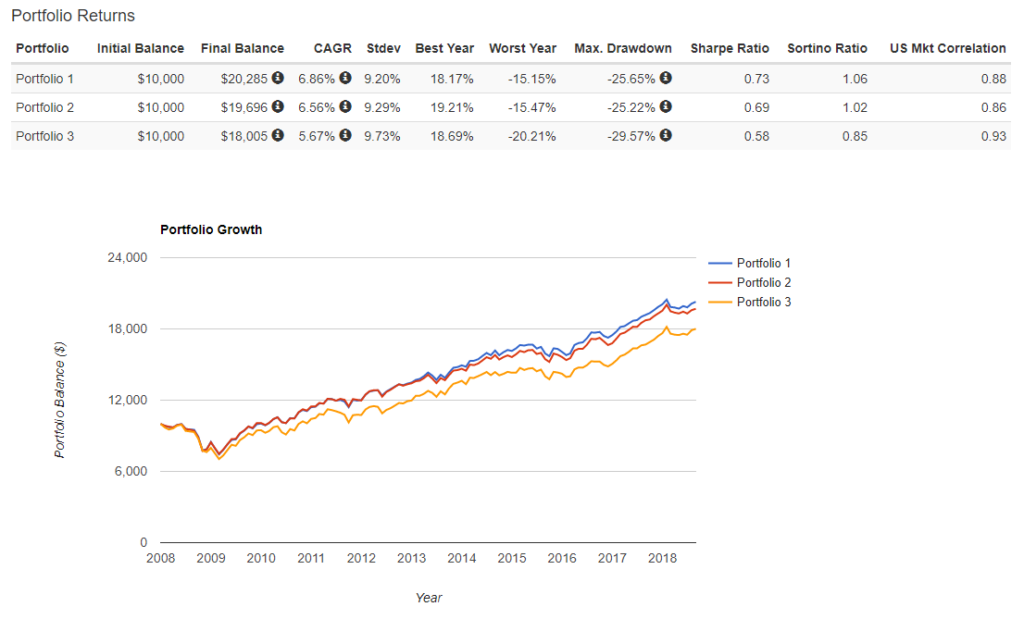
The results weren’t so clear for the balanced portfolio. CGS CIMB eWealth Robo had the best annualised performance, but it was actually quite close to OCBC RoboInvest. And while Smartly beat OCBC RoboInvest from 2011 to 2018, it underperformed the moment you took into account a recession, which indicates that there are certain limitations to the portfolio when handing a financial crisis style situation.
Qualitative Analysis
As any good investment manager will tell you, past performance is not an indicator of future performance. And that’s absolutely right. Just because StashAway’s aggressive portfolio achieved a 12.72% annualised return since 2010 has absolutely no bearing on what it’s returns for the next 10 years will be. So I went to look at the asset allocations for the top 2 aggressive portfolios, and top 2 balanced portfolios.
| StashAway (Aggressive Portfolio) | ||
| Ticker | Name | Allocation |
| VNQ | Vanguard Real Estate ETF | 13.85% |
| XLY | Consumer Discret Sel Sect SPDR ETF | 13.85% |
| SPY | SPDR S&P 500 ETF | 11.88% |
| XLK | Technology Select Sector SPDR ETF | 13.85% |
| VBK | Vanguard Small-Cap Growth ETF | 13.85% |
| CWB | SPDR Blmbg Barclays Convert Secs ETF | 14.85% |
| AAXJ | iShares MSCI All Country Asia ex Jpn ETF | 13.91% |
| GLD | SPDR Gold Shares | 3.96% |
| CGS CIMB eWealth Robo (Aggressive Portfolio) | ||
| Ticker | Name | Allocation |
| VTI | Vanguard Total Stock Market ETF | 15.00% |
| QQQ | Invesco QQQ Trust | 15.00% |
| IJH | iShares Core S&P Mid-Cap ETF | 15.00% |
| VEA | Vanguard FTSE Developed Markets ETF | 15.00% |
| VYM | Vanguard High Dividend Yield ETF | 10.00% |
| VPL | Vanguard FTSE Pacific ETF | 10.00% |
| BLV | Vanguard Long-Term Bond ETF | 10.00% |
| IAU | iShares Gold Trust | 10.00% |
| CGS CIMB eWealth Robo (Balanced Portfolio) | ||
| Ticker | Name | Allocation |
| BLV | Vanguard Long-Term Bond ETF | 15.00% |
| BSV | Vanguard Short-Term Bond ETF | 10.00% |
| BIV | Vanguard Interm-Term Bond ETF | 10.00% |
| VYM | Vanguard High Dividend Yield ETF | 10.00% |
| VTI | Vanguard Total Stock Market ETF | 10.00% |
| VEA | Vanguard FTSE Developed Markets ETF | 10.00% |
| EMB | iShares JP Morgan USD Em Mkts Bd ETF | 10.00% |
| IJH | iShares Core S&P Mid-Cap ETF | 10.00% |
| VPL | Vanguard FTSE Pacific ETF | 5.00% |
| QQQ | Invesco QQQ Trust | 5.00% |
| IAU | iShares Gold Trust | 5.00% |
| OCBC RoboInvest (Balanced Portfolio) | ||
| Ticker | Name | Allocation |
| VTI | Vanguard Total Stock Market ETF | 9.85% |
| IAU | iShares Gold Trust | 9.85% |
| EMB | iShares JP Morgan USD Em Mkts Bd ETF | 10.35% |
| VEA | Vanguard FTSE Developed Markets ETF | 9.85% |
| VPL | Vanguard FTSE Pacific ETF | 9.85% |
| BIV | Vanguard Interm-Term Bond ETF | 9.85% |
| BLV | Vanguard Long-Term Bond ETF | 9.85% |
| BSV | Vanguard Short-Term Bond ETF | 9.85% |
| QQQ | Invesco QQQ Trust | 9.85% |
| VYM | Vanguard High Dividend Yield ETF | 10.85% |
Bond allocation is key
StashAway outperforms all the other robo advisors for one simple reason. It does not hold bonds. Bonds are amazing when there is a recession and investors are fleeing to safety, and bonds can really have a stabilising effect on your portfolio then. But in a roaring bull market like the past 10 years, bonds are a massive drag on your portfolio performance.
It’s so simple that even a retail investor like me pointed it out in my original article on StashAway, so it blows my mind that none of the other robo advisors have implemented a pure equity portfolio to meet investors demand. For this reason, StashAway’s aggressive portfolio will outperform all the other robo advisors in a bull market, but of course, in a bear market, it’s also going to experience the worst losses.
Diversification
There’s a huge difference between StashAway’s aggressive portfolio and CGS CIMB eWealth Robo’s aggressive portfolio. StashAway is far more US centric. Which is interesting because they both purport to offer an aggressive portfolio, but with StashAway you’re actually making a bigger bet on the US, while with CGS CIMB eWealth Robo you’re making a more diversified bet globally.
I actually get that US is the number 1 economy in the world. I also get that the US stock market is the only one that is actually doing well at the moment. If you’re a StashAway investor, you’re probably sitting on pretty decent returns right now because of this. Trust me, my own US portfolio is in double digits year to date. But as a Singapore investor, putting all my life savings into the US market would make me slightly nervous. It’s basically a huge bet on the strength of the US economy, which is great when everything is going well, but when it goes wrong, it may not be pretty. Personally for me, I keep my US allocation to no more than 40% of my investments.
Bottom line, the amount of diversification you’re getting with each robo advisor can vary wildly. You really have to look at the asset allocation they’re giving you, to understand what you’re investing in.
Gold
Strangely enough, all 4 portfolios above have a gold component. OCBC RoboInvest even has a 10% gold allocation. I wrote an article previously on why I am not keen on gold as a long term investment, because simply put, gold is a store of value, and because it doesn’t generate income or cash flows, it just doesn’t generate the kind of returns that can keep up with stocks over longer periods.
It also highlights another problem with robo advisors. You just don’t have control over what goes into your portfolio. You’re forced to accept the asset allocation that is recommended to you, in a cookie cutter approach.
Fees
The fees for all 6 roboadvisors vary wildly depending on your investment sums. I calculated the fees based off 2 different portfolios below (starting from the most expensive):
| Annual fee on a S$50,000 portfolio | Annual fee on a S$100,000 portfolio | |
| OCBC RoboInvest (Aggressive Portfolio) | $750 (1.5%) | $1000 (1.0%) |
| UTrade Robo (UOB Robo) | $440 (0.88%) | $680 (0.68%) |
| Stashaway | $375 (0.75%) | $650 (0.65%) |
| CGS CIMB eWealth Robo | $350 (0.7%) | $600 (0.6%) |
| Smartly | $350 (0.7%) | $500 (0.5%) |
| Autowealth | $275 (0.55%) | $525 (0.525%) |
Frankly speaking, OCBC’s fees are on the high side. Their backtested returns are actually really decent, but the high fees make it hard for me to recommend OCBC RoboInvest. As a rough gauge, I wouldn’t be looking at anything above 0.6% annual fees for a robo advisor. Don’t forget that these are only the fees that you pay to the robo advisor. As you are investing in the underlying ETFs, you also have to pay the fee for the underlying ETFs, which are deducted automatically when calculating your returns.
Which is the best Robo Advisor?
For the aggressive investor, I felt it was very clear that StashAway was the best robo advisor, because it offers an all equity portfolio. If you’re an investor who wants to take on maximum risk, you’re okay going all in on the US market, and can’t be bothered to DIY invest, StashAway is a great choice for you.
For the balanced investor, it’s a lot more tricky, because the results are too close to call, with each portfolio doing well in certain economic conditions. I was actually quite impressed with both OCBC RoboInvest and CGS CIMB eWealth Robo, because the backtested returns looked good, and the asset allocations are fairly well diversified, being split between stocks, bonds and gold. If you held a gun to my head and made me pick, I would say go with CGS CIMB eWealth Robo, simply because their fees are significantly lower than OCBC RoboInvest. All things being equal, OCBC RoboInvest’s underlying portfolio really has to outperform to offset the impact of the higher fees, which is incredibly hard to achieve.
StashAway Referral Code
I know I’ve been hard on StashAway on the past, but I also felt that the backtested returns showed that none of the other robo advisors come close to StashAway for a high risk high return portfolio. As part of this article, I reached out to StashAway’s CEO Michele for a referral code for Financial Horse Readers.
If you sign up through this link below, you get 50% off your fees for the first SGD 50,000 invested for 6 months. That’s about S$94 saved on fees, so if you’re going to check out StashAway, you might as well just use this promo code.
StashAway Referral Link
Robo Advisor vs DIY
There was one chart in particular that I really liked. And it was this chart that compares the top 3 balanced portfolios, against the S&P500. It’s very clear that that the robo advisors outperformed during the financial crisis, all the way from 2008 to around 2014. After 2014, the S&P500 started matching the returns from the balanced portfolio. By 2018, where we are today, none of the balanced portfolio comes close to the S&P500.
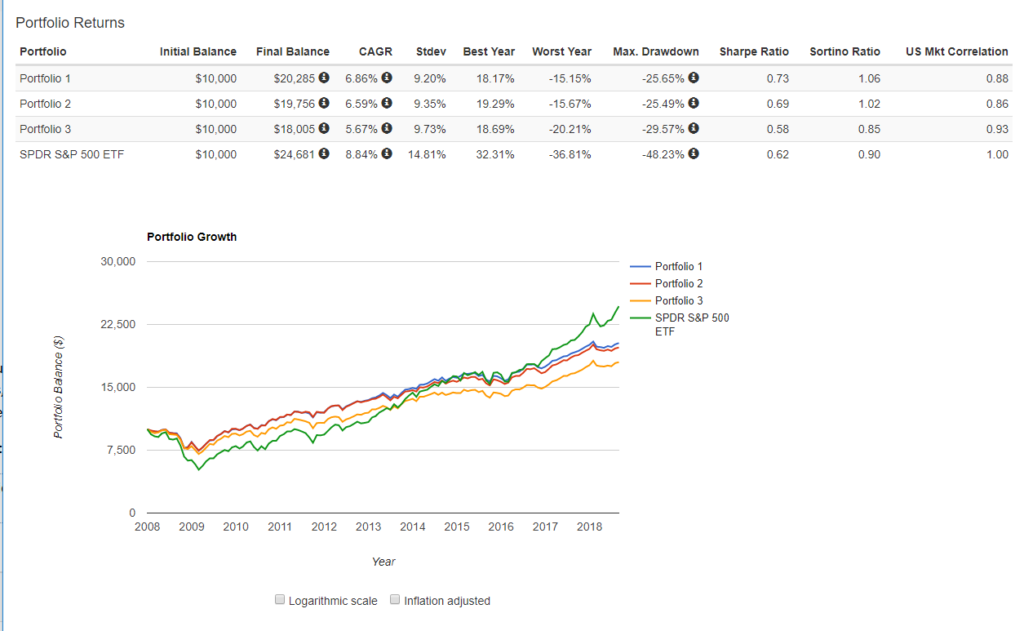
My takeaway? If you’re investing for long, multidecade periods, you’re probably better off just buying a diversified index and forgetting about it for 30 years.
I see robo advisors being good in 2 ways:
- They are good if you are prone to make excessive adjustments to your portfolio. The hardest part in investing is just sitting there and doing nothing, and the robo advisors help because you just don’t have that kind of control to sell a particular stock. With a robo advisor, you just have to ensure that you continue making the monthly contributions, and not sell the investment. The market does the rest.
- They are also good if your investment sums are small. If you’re investing small sums (ie. below S$1000 per transaction), the transaction costs as a percentage of your investment go up drastically. With a robo advisor, you can dollar cost average into a diversified portfolio with 10 ETFs on a monthly basis, without incurring exorbitant transaction fees if you were to buy it manually. Of course, the solution to that is to pool your money so you can make S$3000 plus investments each time, and to keep your portfolio simple (10 ETFs does not mean your performance is 5 times better than someone with 2 ETFs), but it’s nice that robo advisors are not a viable alternative.
Closing Thoughts
If I’ve realised anything when researching this article, it is that investing is not an exact science. Playing around with all the robo advisors, filling up all the questionnaires, gave me the impression that these guys were promising me that I could achieve my goal. If I told them that I was a 30 year old guy saving up for my first condo in 5 years, the robo advisor would tell me that I needed this balanced portfolio with a mix of bonds and equity, and it would generate 6% returns a year over the next 5 years.
But that’s just not how investing works. The global financial markets love making fools out of men much smarter than myself. And if there’s one thing that I’ve learnt, is that you absolutely cannot assume that what worked in the past, will work in the future.
So the backtested returns above show that StashAway, OCBC RoboInvest, and CGS CIMB eWealth Robo all have quite impressive backtested returns. But when you take a look at their underlying asset allocation, they’re actually fundamentally different. So don’t pick StashAway just because some financial blogger ran the numbers and found StashAway to have the best annualised returns. You really need to understand what you’re investing in, what kind of risk you’re taking on with your portfolio, and how much of your net worth you’re comfortable allocating to this investment. This will have profound impact on the future returns of the portfolio.
Financial Horse has a set of 7 Commandments for Successful Investing, that I ask myself before making every investment, and that I will never break regardless of the situation. Enter your email below to receive a copy in your inbox!
[mc4wp_form id=”173″]
Enjoyed this article? Like our Facebook Page for more great articles, or join the Facebook Group to continue the discussion!
Hi Financial Horse, not sure how you are able to get 11.88% allocation to the s&p500 for stashaway’s highest risk portfolio. The asset allocation i get when i set the risk level to the highest on stashaway is as follows:
Vanguard Real Estate ETF 14.8%
XLY Consumer Discret Sel Sect SPDR ETF 14.8%
SPY SPDR S&P 500 ETF 5.9%
XLK Technology Select Sector SPDR ETF 14.8%
VBK Vanguard Small-Cap Growth ETF 14.8%
CWB SPDR Blmbg Barclays Convert Secs ETF 14.8%
AAXJ iShares MSCI All Country Asia ex Jpn ETF 14.8%
GLD SPDR Gold Shares 4%
Cash1%
Total: 99.7%~
Hi James. That’s a great point, thanks for the spot. It was because of how StashAway assigns the allocations in a range, so I allocated the extra allocations into the SPY for backtesting purposes. As you rightly pointed out, perhaps that wouldn’t be the most accurate way to backtest.
In any case, I reran the numbers using the allocation you provided above, and the CAGR remains about the same: Revised Backtesting
It’s quite interesting that this is the case actually, goes to show that you could probably replace most of the asset allocation with the S&P500 and probably hit about the same returns.
That’s true!
Disclaimer. My name is Keir, Founder of Smartly. I really have one question why are we still talking about back-tested results if robo-advisors have been operational for over a year now in Singapore? I didn’t see anywhere in your article references to past years performances. I think it would be much more interesting for people to see how after all the talk and hype actual portfolios are performing, wouldn’t you agree? With back-testing you can show any result you want and I’m sure you are aware of that fact. Personally I have avoided to talk about returns since I don’t believe it should be the core focus or selling point for robo-advisors but it seems that there is no way around it. I’ll will be sharing my own review of real performances shortly, based on initial analysis AutoWealth seems to be best performing (just to make clear that I’m not here to promote Smartly but I am here to bring more transparency into the space and take a look at real numbers).
Regards,
Keir
Hi Keir, thanks for dropping by! I absolutely agree with you, it would of great help to users to see the actual returns since inception for these robo advisors. Unfortunately I do not have access to such numbers, which I acknowledge is a limitation on my part. If you’re able to share actual, independently verified returns since inception, I would love to publish them as an update to this post.
Cheers!
Hi FH, our results below.
I believe you have covered Stashaway returns in a previous post.
We’ll post more about our returns on our blog.
https://www.facebook.com/smartlysg/photos/a.833132283499998/1590961167717102/?type=3&theater
Regards,
Keir
Hi Keir,
Thanks very much for sharing this. I suppose the natural response would be that the S&P500 returned a 19.49% return over the same period, which more than doubles the return on your highest risk portfolio. Any thoughts on this?
Cheers.
And Apple Inc returned close to 40%. Not sure how you can compare a diversified portfolio of ETFs against S&P500 performance. Might as well compare our performance against Apple. Not to mention that in less than a month (in January 2018) S&P500 went down 10%.
I look forward to another year and perhaps next year we can come back and take a look at this article and compare back-tested results with real performance.
Regards,
Keir
I think it’s important not to focus on diversification for the sake of diversification. The S&P500 offers broad exposure to 500 of the largest companies in the world, which is pretty diversified in my books! If the S&P500 can offer better returns and lower risk than a diversified ETF portfolio, I’ll pick the former any day. The question then is whether the S&P500 can outperform a diversified ETF portfolio in the next 10 years (it definitely has in the past 10), which of course is a much trickier question that no one can answer definitively.
Fully agree with you on looking forward to the new year. There’s no substitute for actual returns!
Anyway it’s been great talking with you here, and feel free to reach out if you need anything at all!
Hi Keir! It’s nice seeing you chime in. Really looking forward to the review and closely monitoring this thread!
Hello, great article, could you touch on the Thematic portfolio that offer by the OCBC and CGS-CIMB? I would like to know your opinion about the bucket of stock that selected by the robo.
That’s an interesting question, although I might admit I didn’t take an in depth look at the basket of stocks. I do remember looking at the tech heavy basket, and my thought was that it basically mirrors the NASDAQ index. If you had just bought the NASDAQ directly through the QQQ, you would have outperformed their tech thematic portfolio, and paid a lot less fees.
Are you referring to QQQ ETF which track NASDAQ100? I take a quick look on your recommendation, you are right and 2 of the stocks in the tech heavy portfolio of CGS-CIMB is in the top 10 of the QQQ ETF.
I can see the HK REIT is very expensive investment in the thematic portfolio
Yes that’s right. My thoughts were that there are far cheaper ways to play the theme in question (whether tech, china, REITs etc) through an ETF, than to use CIMB robo and incur far higher fees. In fact, most of the times the ETF will outperform the CIMB selection, it’s incredibly hard to outperform a diversified stock index these days.
StashAway’s CEO is actually doing an AMA on this alternative investing community forum. You guys might want to check it out! https://crowdfundtalks.com/topic/354/alternative-investing-robo-advisory-ama-ask-me-anything-with-michele-ferrario-ceo-and-co-founder-of-stashaway-thursday-27th-august-8-30-9-30pm/
Hi
Great comparison article. I notice that FSM’s MAPS robo advisory is not on your list. Any reason why?
It’s a very simple reason, I didn’t know about them until your comment! Thanks for raising this though, I’ll see if I can take a look at them in a future article.
for CIMB – Exchange charges such as clearing fee, stamp duty, taxes, and other tariffs are deducted as and when incurred. We pass these costs to you as incurred.tis part is unknown but doesnt seem like other roboadvisors charge this?
That’s interesting, thanks for raising this. From what I understand, most of the other robos will absorb this fee, as they build it into the annual AUM fee. I suppose exchange charges as a % of investment are very low, but worth noting nonethless.
CIMB – Exchange charges such as clearing fee, stamp duty, taxes, and other tariffs are deducted as and when incurred. We pass these costs to you as incurred.
Hi Keir, Please fix your onboarding process. Its not intuitive to understand what documents are pending for submission. For comparison, stashaway’s onboarding process is amazing. They even have a real person talking guiding you with the process. Customer experience matters. I’m invested with Stashaway and tried setting up Smartly but gave up eventually.
Hey Financial Horse, I went through your article comparing Stashaway with Autowealth where you recommended Autowealth over Stashaway but based on the returns that you showed here, Stashaway seems to be beating Autowealth in both the balanced as well as aggressive portfolio. Does this mean that Stashaway’s reoptimization strategy is better than Autowealth’s?
Hi there,
That would likely indicate that the asset allocation picked by StashAway is better than Autowealth. Of course, whether this will continue to hold true for the next 10 years is anyone’s guess! Both StashAway and Autowealth may well make changes to their strategies going forward.
Hi
Welcome opinions on FSMONE MAPS and Robo WBEN forms etc.
Having reviewd MAPS the concept is similar, the fees serm very competive is 0.5% for conservative MAPS and 0.75% for the balanced and agressive with no platform fees. I also like the usability and layout of the FSMONE platform compared to others I have used
However the Funds seem to be principally unit trusts / mutual funds which have high underlying fund management fees some 3% to 5%. I see very few if any ETF in the portfolios these unit trust/ fund fees are going to erode returns in the long term compared to a portfolio of low cost ETFs. If FSMone also had bag of ETF MAPS portfolios I would consider signing up to save myself the need for manual rebalancing and the associated fees.
I wonder if anyone else has done their own review and drawn similar conclusions?
Other:
Personnaly I am leaning towards robo-advisors only concern is the ETFs a mostly US domicled considering withholding tax and potential >60k estate tax.in the latter case as I have yet to see a definitive confirmation in this regard.
Number of blogs all state similar concerns. Although as everyone is Grouped under the “corporate” banner this is potentially why it is not considered. Have the roboadvisors confirmed the same?
Do investors have to compete WBEN Form when signing up with the RoboAdvisors?
Is there any confirmation on the ability to claim back the tax for the portfolio bond funds? If so is this “openly” re-invested and investors informed?
In considering the 30% withholding tax at source by experience I have claimed 15% deduction based on country of residence which is done at source by the broker due to my details of the WBEN each year. I assume this Tax benefit is not possible with the roboinvestors if all investors are “grouped” under the corp banner?
Does anyone have experience of CGS CIMB eWealth Robo which are more globally diversified?
Thanks
“Bored of rebalancing”
Hello,
I have a question, if I were to get an ETF that directly tracks the S&P index, would it be better to do it my own or rely on these robo advisors, I don’t get the Portfolio part, does that means they consist of all the above ETFs you mentioned.
I’m not looking for diversification as ETF is alrdy very diversed in nature. Instead would like to focus on one single ETF. What are your thoughts?
Which would be the cheaper platform to use? Custodian or robo advisors?
Yeah, as long as you’re investing fairly large sums where the transaction fees as a % of your investment are low, DIY investing will be cheaper than Robo advisors. I think 1 ETF is tricky because you may not get the kind of asset allocation you need to perform well in all scenarios (eg. even if you buy something like IWDA, you wont get exposure to bonds or gold or commodities, so in certain economic regimes you can underperform).
Saxo is one of the cheapest platforms so far, there is a referral link here if you need: https://financialhorse.com/stock-brokers/
I’m considering a few of the ETF options..VOO or VUSD.. I was wondering if it would be better for a fellow singaporean to get VUSD due to lesser tax.
On one hand, VOO has a larger volume while VUSD has lower tax. I’m planning to allocate majority of my funds in either on of them for a long term. What are your advices?
As long as liquidity is decent, I would go for the one with better tax treatment, for myself.