
Now I’m not going to deny that the recent market rally has got me really worried. I get all the reasons for why it’s happening – US-China trade truce, cyclical rebound, election year etc, but it still feels like it’s coming too fast too soon. I’m sitting on huge gains made just over the past 1 – 2 months. It reminds me a lot of the Jan 2018 market melt-up, just before they dropped for the rest of the year.
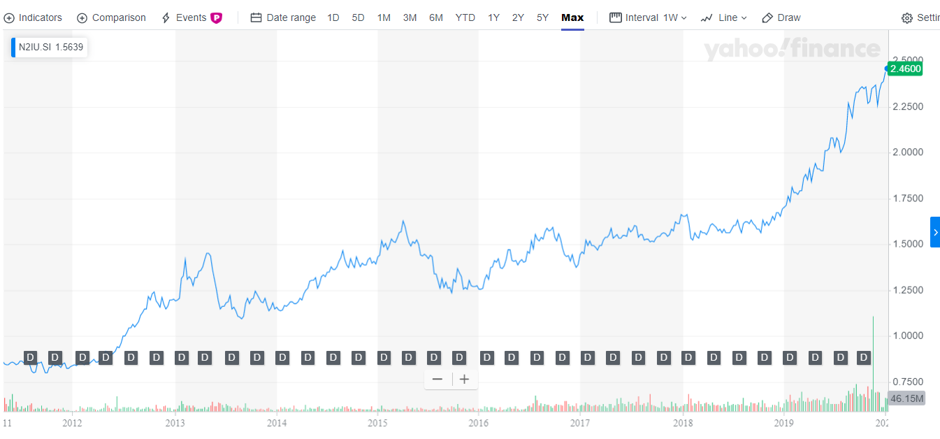
Mapletree Commercial Trust is one of my biggest holdings. And when I look at the chart, I can’t help but wonder if the recent rally is sustainable. I bought this back in 2018 when everyone was freaking out over rate hikes, and it has gone from 1.5 to 2.46, or a 60% rally. It’s trading at a 3.7% yield (2% yield spread) and a 43% premium to book. Is this getting ahead of itself? Is there money to be made to cash out and sit on the sidelines for a year or two?

So I wanted to use this article to really examine the hard data, to understand if my hunch is right – is a market crash coming in the short and longer term?
And before we begin, I want you to know that no one knows the answer to this question, myself included. This is just going to be an educated guess based on data available. Anybody who tells you otherwise, who professes to know the answer 100%, is either (1) unaware of the fact that he is wrong, or (2) aware that he is wrong, but is trying to sell something to you, whether it is a product or his services.
Basics: What does the data show?
Let’s start with the long term chart for the S&P500. I love this chart because it really helps to put things in perspective. The current rally has been going since 2009 and is now at its 11th year, setting the record for the longest bull market ever. But of course, there’s no rule that says that bull markets must die after a certain age, they can keep going as long as people keep buying.


What about valuations? Traditional P/E is not a great metric to analyse long term trends because it’s not cyclically adjusted, so we’ll use the Schiller P/E cyclically adjusted price earnings:

Prof. Robert Shiller of Yale University invented the Schiller P/E to measure the market’s valuation. The Schiller P/E is a more reasonable market valuation indicator than the P/E ratio because it eliminates fluctuation of the ratio caused by the variation of profit margins during business cycles. This is similar to market valuation based on the ratio of total market cap over GDP, where the variation of profit margins does not play a role either.
Shiller P/E: 31.5 ( %)
Shiller P/E is 85.3% higher than the historical mean of 17
Implied future annual return: -2.5%
Historical low: 4.8
Historical high: 44.2
S&P 500: 3289.29
Regular P/E: 25 (historical mean: 16.1)
Long story short, Schiller P/E shows that stock valuations are really high right now. They’re 85.3% above their historical mean, and above the heights of Black Tuesday (ie. the great depression) and Black Monday. But it hasn’t reached the insanity of the dot com boom yet.
The thing about valuations is that even though it tells us that stocks are expensive on a historical basis, and will probably go down in the future, it does nothing to tell us about the timing of that crash. Stocks are expensive, but they can get a lot more expensive. Just look at the dot com boom and how high it went.
We’ll need to dig deeper, by looking at some underlying economic data.
Interest Rates
Some of you may wonder why I’m using mostly US Charts in this article. And the simple reason is that the US economy is the number one global economy in the world today. The Federal Reserve sets US monetary policy which sets the benchmark for global monetary policy. So as much as we hate it, Trump is right – the world does depend on the US. China is rapidly growing in importance to the world, and they will be relevant to this discussion, but they’re not at the point where they dictate global monetary policy just yet. That requires more time.
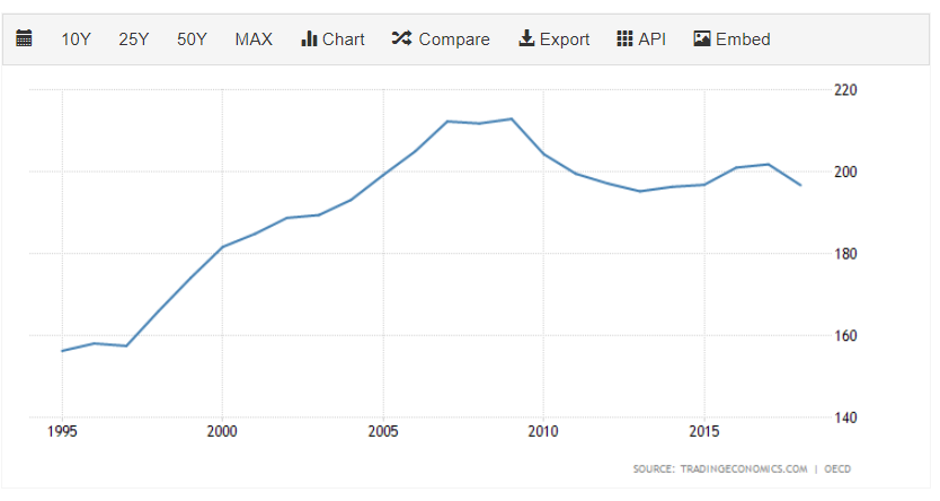
I’ve set out the long-term US interest rate trend below. Key takeaways are: (1) We’re on a 40 year long term interest rate cutting cycle (or bond market bull run), (2) monetary policy is going to be ineffective in the coming years because we’re already close to the zero bound, (3) this is going to spark a paradigm shift as the 40 year long term cycle comes to an end. With monetary policy as a tool likely to be ineffective in the coming years, the next cycle will likely see fiscal policy coming into play in a huge way (basically US doing what China did in 2008, huge government and infrastructure spending), which is going to be inflationary.

Market expectations as to interest rate policy is set out below. To break it down simply, last year the market was pricing in huge rate cuts from the Feds, this year – they’re generally agreeing with the Feds that no more rate hikes are required. This seems to indicate that 2020 would be at least relatively stable.

3s10s yield curve is set out below. The 3s10s inverted last year, which historically gives us about 12 to 18 months until a recession. There’s a lot of talk about how the yield curve is no longer effective these days because of how QE has distorted interest rates, but I’m going to skip all that debate here. Yield curve is signalling trouble for the economy going forward. Whether you trust the signal, is up to you.

Unemployment
The unemployment numbers really help to put things in perspective further. Say what you want about Trump, but this has been the greatest US economy in history. Just look at that unemployment curve.

Debt levels
Government debt and private debt as a % of GDP are set out below respectively. Key takeaway is that (1) Government debt is high, and (2) private debt is high but relatively more manageable. This indicates that in the next recession, government debt is going to be a problem. But again, it doesn’t tell us much about timing of the crash.


Sentiment
The CNN Fear & Greed Index is a great (and quick) way to check investor sentiment.

It’s now pointing at Extreme Greed, when just 1 year ago we were at Fear.
Anecdotally, most data seems to back these up, as all the shorts have been wiped out, and most bears have been forced to buy into stocks.
This is not good. Market crashes happen when investors are greedy and all-in, not when they’re fearful and holding large cash positions.
US PMI and China PMI
US and China PMIs are set out respectively below.


US PMI is recovering from its low, while the China PMI is at a 3 year high. This is generally bullish for stocks.
Other data
Some other bits of information that are relevant are:
- China liquidity injection – China did a big liquidity injection on 1 Jan 2020, that seems to signal to the market that they’re going to loosen monetary policy in 2020. This sparked a huge rally in China stocks.
- Rebound of Cyclical Stocks – Cyclical stocks (esp semiconductors) have rebounded in a big way. If this price action is to be believed, an economic recovery may be on the cards here
- Donald Trump reelection in Nov 2020 – The biggie of the year. It says a lot about the state of politics when everything that’s going on in the global economy this year is preparing for this man’s re-election in November. But hey, I take the markets as I see them, and not as how I hope they will be. This man will do anything to stay in power, even if it means keeping stocks are ridiculous valuations.
What does the data point towards – Is a market crash coming?
Surprisingly, what the general economic data seems to be pointing towards is for a relatively stable near term. There’s no denying that stock valuations are high (from Schiller P/E), but this doesn’t mean they can’t go even higher, and in the short term at least, monetary policy and government policies are likely to be favourable to the economy. Don’t forget that it’s Trump’s election year, so he’s going to try to juice the economy as well.
I’m actually really agreeing with the market and Feds on rate hikes here –no rate cuts or hikes are likely over the next 12 months. This is actually great because it sets up a stable platform for the economy, as the rate cuts from 2019 start to kick in due to time lag.
The fact that sentiment is so high though, is not great. it indicates that there could be a mild near-term correction in prices. But my take at least, is that 2020 should be somewhat stable.
What am I going to do – Is it time to sell stocks / REITs in Singapore?
I love going through economic data like this because it really helps me put things in perspective. I started out with a thesis that stocks are overvalued and bound for a crash. Going through the hard economic data, leads me to think that the current rally may just be justified, and may just continue at least for 2020.
Don’t get me wrong, I think that this cycle will inevitably end. And when it does, it will end badly, probably the worst of our generation. The next recession is likely going to spark the end of this long term debt cycle (remember that 40 year interest rate cut cycle?). It’s going to trigger a paradigm shift in the global economy, and short term at least, it’s going to destroy a lot of portfolios who are sitting on leveraged long positions.
But my gut feel, is that we’re not there yet. So for the time being, I’m staying invested in this market, but gradually shifting towards more defensive asset allocations (Patrons can see my exact portfolio breakdown).
As always, this article will not be updated going forward, so please do your own due diligence before relying on it. If you want my updated thoughts on the economy / stocks, do consider supporting this site as a Patron for additional exclusive content.
If you enjoyed this article and want to learn how to source and analyse all this data on your own, do also check out the FH Complete Guide to Investing, which covers all the above and more in much greater details.
What do you think about the state of the economy? Is a big market crash on the cards here? Share your comments below!
Looking for a comprehensive guide to investing? Check out the FH Complete Guide to Investing for Singapore investors.
Support the site as a Patron and get market and stock watch updates. Big shoutout to all Patrons for their support!
Like the Financial Horse Facebook Page and join the Facebook Group (Singapore Stocks) or Facebook Group (China/HK Stocks) to continue the discussion!
The thing about StashAway and Syfe is that they work well when theres a major downturn (and not so well when its a bull run). I’m undecided whether to go all-in into them to ride out until the downturn comes.
Hi! You meant to refer to the opposite right? StashAway does well in a bullrun and not a downturn? I actually think StashAway does more of a balanced portfolio. They don’t do so well in a bull run (as compared to a pure SPY/QQQ ETF), and in a downturn they won’t lose as much as the SPY/QQQ.
I like your analysis because it’s sensible and practical. I agree that the run-up in equity markets is worrying but it’s difficult to predict when the next dip or even crash is. I still think staying vested in equity markets is useful just because having long positions help us to benefit from global economic growth if it does keep going.
But I continue to maintain the same cash percentage position (at 50%) as a buffer, which means my cash balance increase every month as total assets go up. Because you never know what can happen.
Thanks for sharing your thoughts! Agreed on this, I’m maintaining a relatively balanced portfolio as well. Your cash position is really big though. Are you including your bonds (eg. SSBs and CPF-OA) as the cash component as well?
Hi. To clarify, I meant their tactical asset allocation. Relative to a fixed 60/40 for example, their algorithms usually do better especially after going through a downturn. So if one is afraid of an impending crash, StashAway or Syfe might be an option to ride out till the coast is clear.
Hmm interesting, how would you know that their algorithms do better than a 60/40? Backtesting will not be accurate because the next downturn will likely look different from the past few. The only way I can think of is a mix of backtesting (over a 100 year period) and reasoning from base principles, but we don’t have full data on how the algorithms work to perform such an analysis.
Robo advisors are marketing a supposedly advanced algorithm that can perform in all market conditions but if you look at their actual allocation it just seems to be a very traditional allocation across a bunch of ETFs depending on your risk profile. The problem is that they add a 0.5-1% yearly management charge on top of the underlying ETFs expense ratio for that allocation.
I really feel like their strength is more the trendy marketing and good interface rather that their actual algorithm.
Haha I really like this comment. Man after my own heart. Absolutely agreed with you on this sir!
Hi sgtrades and Financial Horse,
I am not a good communicator so whatever I type may just lead to more misunderstanding. It remains to be seen how StashAway and Syfe’s algorithms will work. I am keen to know when the downturn comes. Let’s observe till then.
Still waiting for your review on Syfe btw 🙂
Well realistically speaking, we just dont have enough information on any of their algorithms to really comment on the issue intelligently. Most of them are just blackboxes to us. It could well be that they outperform in the next downturn. Let’s see how this plays out. 🙂
Just exackly how is Trump controlling the markets?..
Well there are many tools at his disposal, official or otherwise (eg. pressure on the feds to cut – which they did, US-China trade war truce, fiscal policy, or just plain ol tweets that move the market). 😉
Hi there,
Just wanted an opinion from both of you. Noted that 0.5 = 1 % yearly management charge is a little pricey.
However, as someone who doesn’t have the capacity to dollar cost average huge amounts of money into S&P, would RoboAdvisors be an appropriate choice (We are talking about SGD 300 per month)?
Else, are there other avenues to dollar cost average into ETFs/S&P’s that are not covered by regular savings plan (by DBS, POEMS etc.).
Look forward to you reply!
If you’re look at about SGD300 per month, I think the RoboAdvisors are a very competitive alternative to DIY investing actually. Cuts away the minimum fees you’ll need to incur on each trade. So yes, I would definitely look at them seriously. 🙂
I can’t remember having seen FH commenting on the FTSE100 in the UK. It’s trading at a 15% P/E at close to 5% yield and Sterling will very likely go up when the Brexit challenges are sorted out. Sounds like a great opportunity!
Ooh interesting. Europe is a really really interesting one. I agree that valuations are much cheaper than the US, but I also think they are cheaper for a good reason (future growth). I havent made up my mind on whether it is a good opportunity yet, but perhaps I’ll try to do an article on this maybe via Patron. 🙂
Hi Financial Horse, what would you advise for someone sitting on a large cash warchest looking to invest globally? Since the rally may very well continue into 2020, would you recommend DCA every month for the year 2020 and onwards, or to hold out for the next dip or crash, and go all in?
Well it really depends on your risk appetite, it’s incredibly hard to advise without knowing your risk appetite and investment objevtives. If it were me? I’ll probably look to average into the market slowly, but maintain a more defensive/balanced portfolio since we’re looking quite late stage here. But that’s really just me, and it may not be applicable in your situation. 🙂