A lot of you have been writing in with worries about inflation.
House prices are going up.
COE prices are going up.
Food prices are going up.

What’s a Singapore investor to do in times like that?
How best to invest your wealth to hedge against inflation this decade?
Note: This article is sponsored by Nikko AM Asia. All views and opinions expressed in this article are from Financial Horse.
Asia’s favourite asset class…
Ah yes… real estate.
Older investors tend to swear by real estate as the only true form of investment, the only real inflation hedge.
Not only do you get benefits of regular rental income, you also get the upside of potential capital appreciation.
Now I do agree that real estate can be a decent hedge against inflation, or depreciation of fiat currency.
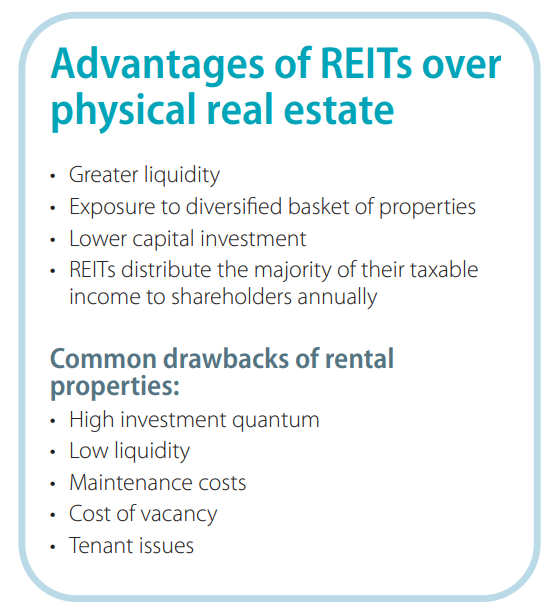
But there’s no denying that physical real estate has its own drawbacks.
You need significant upfront capital to buy physical real estate, it’s not easy to sell your stake quickly, transaction cost is very real. And not to mention the time and effort to maintain the property and manage tenants is no joke.
REITs solve this?
REITs offer exposure to the commercial real estate class, but require much lesser upfront capital, and much lesser effort.
Everything is handled by a professional manager, and you can invest any amount you like.
You can also sell your stake on the open market at any time and get regular rental income (via distributions).
Real Estate: One… vs Many…
There are 2 ways of investing in REITs.
You can:
- Pick individual REITs
- Buy a REIT ETF
Advantages of REIT ETF
The benefit of a REIT ETF is that it gives you very easy, diversified exposure to a broad basket of REITs.
If you don’t want to fuss with stock picking, or if your investment sums are small, a REIT ETF might be the most efficient way to get exposure to this asset class.
Potential Drawbacks of REIT ETF
The cons though, are that you need to pay management fees, and liquidity could be a concern at times.
This can be mitigated if you are careful about picking the right REIT ETF though.
Let’s run through this by looking at Singapore’s largest REIT ETF.
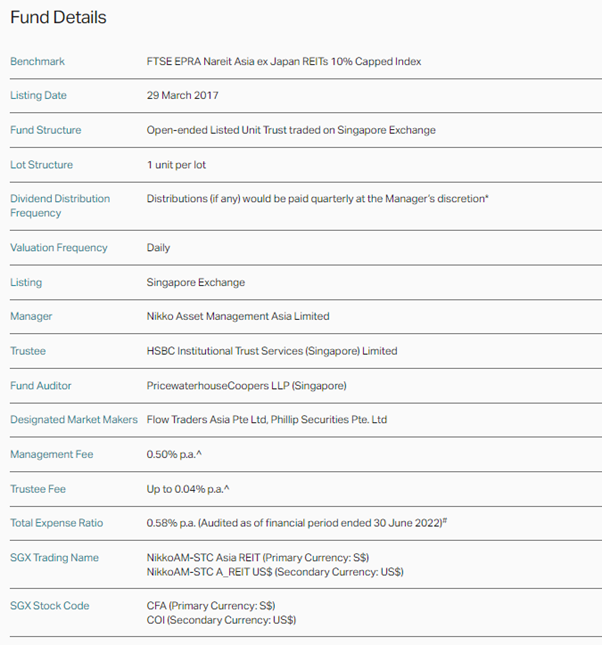
NikkoAM-StraitsTrading Asia ex Japan REIT ETF – Largest Singapore listed REIT ETF
ETFs have economies of scale.
The bigger the ETF, the better the liquidity, the lower the tracking error, and the lower the fees (usually).
Bigger is almost always better when it comes to ETFs.
In Singapore – NikkoAM-StraitsTrading Asia ex Japan REIT ETF is the largest REIT ETF, with $386 million assets under management (AUM) (as at 30 September 2022).
* Distributions are not guaranteed and are at the absolute discretion of the Manager.
^ Usual brokerage and handling charges to apply. Please refer to the Fund Prospectus for complete information on the Fund, relevant disclosures and fees payable.
# Management Fee and Trustee Fee are included in the calculation of Total Expense Ratio.
Asset Allocation of NikkoAM-StraitsTrading Asia ex Japan REIT ETF
The NikkoAM-StraitsTrading Asia ex Japan REIT ETF tracks the FTSE EPRA NAREIT Asia ex Japan Net Total Return REIT 10% capped Index, which is a widely used global benchmark for real estate stocks.
Each individual REIT is capped at 10% to reduce concentration risk
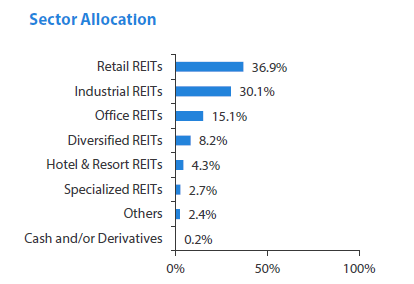
The asset breakdown is set out below, which gives you a broad mix across real estate classes.
Retail is the largest at 36.9%, followed by Industrial (30.1%) and Office REITs (15.1%).
Broad Exposure to Asian REITs (excluding Japan)
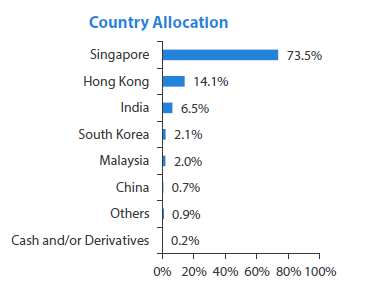
What is interesting is that the NikkoAM-StraitsTrading Asia ex Japan REIT ETF is not limited to Singapore REITs.
Singapore REITs make up 73.5% of the index, with the rest being Asia REITs (Hong Kong, China, India etc)
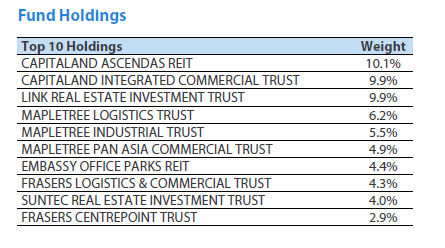
You can see this reflected in the Top 10 Holdings.
The 3rd largest holding is actually a Hong Kong REIT – Link REIT.
Is this diversification to Asian REITs good or bad?
Personally, I like it.
The way I see it, if I’m running a passive strategy, and I want exposure to REITs – the greatest benefit an ETF can bring is diversification.
The NikkoAM-StraitsTrading Asia ex Japan REIT ETF allows easy access to a basket of Asian REITs as compared to other ETFs that may just invest in a single country REIT.
Dividend Yield of NikkoAM-StraitsTrading Asia ex Japan REIT ETF
NikkoAM-StraitsTrading Asia ex Japan REIT ETF pays a quarterly dividend*.
This is great because it gives you more regular cash flow as an investor.
Trailing 12-month dividend yield is about 5.78% (as of 26 October 2022, using data from Bloomberg).
NikkoAM-StraitsTrading Asia ex Japan REIT ETF
Dividend data date range from 2017 – 2022
|
Trailing 12 Month Dividend Yield (1) |
5.78% |
|||||
|
Closing Price as of 26 Oct 2022 |
SGD 0.867 |
|||||
|
Payment Frequency |
Quarterly |
|||||
|
Declaration |
Ex Date |
Record |
Payable |
Currency |
Gross Amount |
Type |
|
09/15/22 |
10/3/2022 |
10/4/2022 |
11/4/2022 |
SGD |
0.0127 |
Distribution |
|
06/15/22 |
7/1/2022 |
7/4/2022 |
8/4/2022 |
SGD |
0.0122 |
Distribution |
|
03/15/22 |
4/1/2022 |
4/4/2022 |
5/9/2022 |
SGD |
0.0127 |
Distribution |
|
12/15/21 |
1/3/2022 |
1/4/2022 |
2/7/2022 |
SGD |
0.0125 |
Distribution |
|
09/15/21 |
10/1/2021 |
10/4/2021 |
11/3/2021 |
SGD |
0.0125 |
Distribution |
|
06/15/21 |
7/1/2021 |
7/2/2021 |
8/4/2021 |
SGD |
0.0115 |
Distribution |
|
03/15/21 |
4/1/2021 |
4/5/2021 |
5/5/2021 |
SGD |
0.0116 |
Distribution |
|
12/15/20 |
1/4/2021 |
1/5/2021 |
2/4/2021 |
SGD |
0.0112 |
Distribution |
|
09/15/20 |
10/1/2020 |
10/2/2020 |
11/3/2020 |
SGD |
0.0138 |
Distribution |
|
06/15/20 |
7/1/2020 |
7/2/2020 |
8/4/2020 |
SGD |
0.0155 |
Distribution |
|
03/16/20 |
4/1/2020 |
4/2/2020 |
5/6/2020 |
SGD |
0.0146 |
Distribution |
|
12/13/19 |
1/2/2020 |
1/3/2020 |
2/5/2020 |
SGD |
0.0139 |
Distribution |
|
09/16/19 |
10/1/2019 |
10/2/2019 |
11/4/2019 |
SGD |
0.0125 |
Distribution |
|
06/14/19 |
7/1/2019 |
7/2/2019 |
8/1/2019 |
SGD |
0.0113 |
Distribution |
|
03/15/19 |
4/1/2019 |
4/2/2019 |
5/6/2019 |
SGD |
0.0118 |
Distribution |
|
12/17/18 |
1/2/2019 |
1/3/2019 |
2/1/2019 |
SGD |
0.0138 |
Distribution |
|
09/17/18 |
10/1/2018 |
10/3/2018 |
11/5/2018 |
SGD |
0.0129 |
Distribution |
|
06/14/18 |
7/2/2018 |
7/4/2018 |
07/16/18 |
SGD |
0.01046 |
Distribution |
|
12/15/17 |
1/2/2018 |
1/4/2018 |
01/15/18 |
SGD |
0.01117 |
Distribution |
|
09/14/17 |
10/2/2017 |
10/4/2017 |
10/16/17 |
SGD |
0.01128 |
Distribution |
|
06/15/17 |
7/3/2017 |
7/5/2017 |
07/17/17 |
SGD |
0.01248 |
Distribution |
(1) Trailing 12 month dividend yield is calculated by taking the actual dividend payments made by the ETF over the last four quarters, divided by the last closing price of the ETF.
Source: Bloomberg, as of 26 October 2022
* Distributions are not guaranteed and are at the absolute discretion of the Manager.
Historical price performance of NikkoAM-StraitsTrading Asia ex Japan REIT ETF
The long-term price chart for NikkoAM-StraitsTrading Asia ex Japan REIT ETF (excluding dividends) is set out below.
Very much in line with the typical REIT asset class, where you had the runup in 2019 after the last Fed hike cycle, and the plunge in 2020 due to COVID.
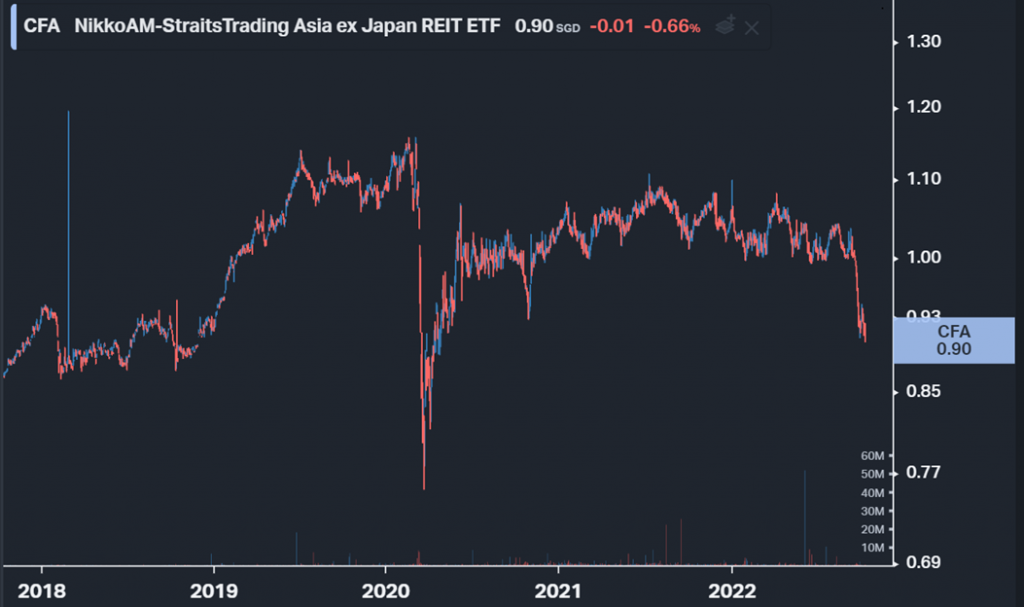
Long term price performance since inception in 2017 is 3.03% annualised (as of 30 September 2022).
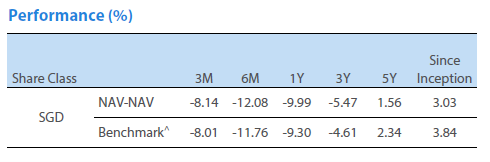
Returns are calculated on a NAV-NAV basis and assuming all dividends and distributions are reinvested, if any. Returns for period in excess of 1 year are annualised. Past performance is not indicative of future performance.
Will rising interest rates affect REIT prices?
I get a lot of questions on how rising interest rates will affect REIT prices in the short term.
Frankly, the answer is not so straightforward because it will go back to what is priced in by the market, and the price you are buying at. You need to look at everything from the location of the real estate to the cap rates used to value to the real estate. And the answer may differ for each REIT.
That said – if you’re a passive long-term investor, looking to dollar cost average into a REIT ETF for the next decade or two, then perhaps this is not necessarily a debate you may want to concern yourself with.
In fact, you may want to hope for falling REIT prices, because it may allow you to dollar cost average at a lower cost basis.
So, for long-term investors, you may want to tune out all the short-term noise and focus on building ultra long-term positions.
That’s how passive dollar cost averaging (“DCA”) strategies are meant to work.
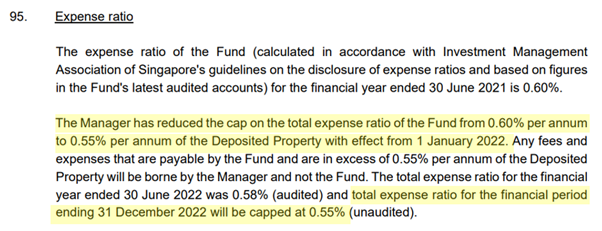
Management Fees and Total Expense Ratio of NikkoAM-StraitsTrading Asia ex Japan REIT ETF
The management fee is 0.50% with total expense ratio is capped at 0.55%, which is priced competitively to other REIT ETFs in the market.
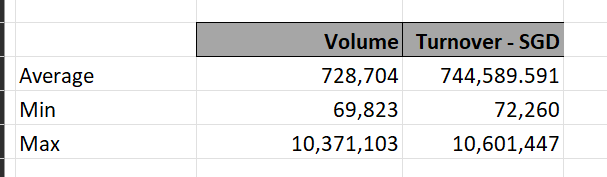
Liquidity of NikkoAM-StraitsTrading Asia ex Japan REIT ETF
Liquidity can be a big concern for many Singapore listed ETFs.
You know, those ETFs where only a few lots are traded on the open market each day.
This can make it difficult to exit a big position on the open market quickly, without a large bid-ask spread.
The 3 months average trading volume is about 728,000 units or $744,000 a day, which is acceptable.
Is NikkoAM-StraitsTrading Asia ex Japan REIT ETF a good investment?
Personally if I were running a passive DCA style strategy, NikkoAM-StraitsTrading Asia ex Japan REIT ETF would probably be one of my top picks for a REIT ETF.
Reasons being primarily of its size (largest AUM among REIT ETFs in Singapore) and broad Asian diversification.
With NikkoAM-StraitsTrading Asia ex Japan REIT ETF you get broad exposure to Asian REITs (excluding Japan).
And it’s the largest REIT ETF in Singapore with $386 million AUM (Source: Nikko Asset Management Asia Limited, as of 30 September 2022), a fair bit larger than the next biggest REIT ETF with less than $300 million AUM.
But that said, it really depends on the kind of investor you are.
If you plan to actively trade REITs, and pick individual undervalued names, ETFs are probably not for you.
But if you’re a long-term investor and want to gain exposure to Asian REITs as an asset class. Or you’re an active investor and want a vehicle to trade Asian REITs as an asset class generally then the NikkoAM-StraitsTrading Asia ex Japan REIT ETF is worth looking at.
However, investors should take note that like all investments, this ETF is subject to investment risks such as market risk and geopolitical risk.
On a sidenote, Nikko AM Asia also won the best ETF provider in Singapore 2022 awarded by The Asset:

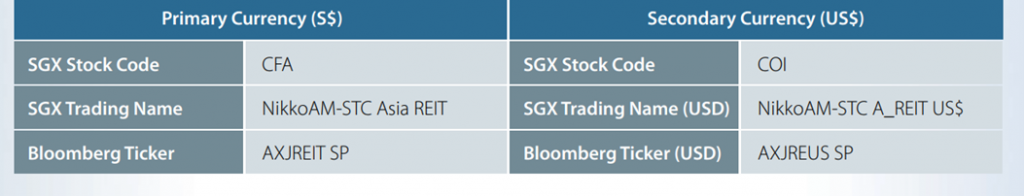
How to buy the NikkoAM-StraitsTrading Asia ex Japan REIT ETF (via open market)
The NikkoAM-StraitsTrading Asia ex Japan REIT ETF is listed on the SGX, so buying it is as simple as buying on the open market.
There’s a SGD listed counter under stock code CFA, and a USD listed counter under stock code COI.
CPFIS inclusion
NikkoAM-StraitsTrading Asia ex Japan REIT ETF is also the only Singapore listed REIT ETF that is included in CPFIS (as at 24 September 2022).
This means you can use your CPF-OA monies to invest in NikkoAM-StraitsTrading Asia ex Japan REIT ETF.
The other SGX listed REIT ETFs currently do not offer this, so this is a big plus point.
Are you a fan of REIT ETFs? Or do you prefer to pick individual REITs?
Let us know in the comments below!
Note: This article is sponsored by Nikko AM Asia. All views and opinions expressed in this article are from Financial Horse.
Important Information
This document is purely for informational purposes only with no consideration given to the specific investment objective, financial situation and particular needs of any specific person. It should not be relied upon as financial advice. Any securities mentioned herein are for illustration purposes only and should not be construed as a recommendation for investment. You should seek advice from a financial adviser before making any investment. In the event that you choose not to do so, you should consider whether the investment selected is suitable for you. Investments in funds are not deposits in, obligations of, or guaranteed or insured by Nikko Asset Management Asia Limited (“Nikko AM Asia”).
Past performance or any prediction, projection or forecast is not indicative of future performance. The Fund or any underlying fund may use or invest in financial derivative instruments. The value of units and income from them may fall or rise. Investments in the Fund are subject to investment risks, including the possible loss of principal amount invested. You should read the relevant prospectus (including the risk warnings) and product highlights sheet of the Fund, which are available and may be obtained from appointed distributors of Nikko AM Asia or our website (http://www.nikkoam.com.sg) before deciding whether to invest in the Fund.
The information contained herein may not be copied, reproduced or redistributed without the express consent of Nikko AM Asia. While reasonable care has been taken to ensure the accuracy of the information as at the date of publication, Nikko AM Asia does not give any warranty or representation, either express or implied, and expressly disclaims liability for any errors or omissions. Information may be subject to change without notice. Nikko AM Asia accepts no liability for any loss, indirect or consequential damages, arising from any use of or reliance on this document. This advertisement has not been reviewed by the Monetary Authority of Singapore.
The performance of the ETF’s price on the Singapore Exchange Securities Trading Limited (“SGX-ST”) may be different from the net asset value per unit of the ETF. The ETF may also be suspended or delisted from the SGX-ST. Listing of the units does not guarantee a liquid market for the units. Investors should note that the ETF differs from a typical unit trust and units may only be created or redeemed directly by a participating dealer in large creation or redemption units.
The Central Provident Fund (“CPF”) Ordinary Account (“OA”) interest rate is the legislated minimum 2.5% per annum, or the 3-month average of major local banks’ interest rates, whichever is higher, reviewed quarterly. The interest rate for Special Account (“SA”) is currently 4% per annum or the 12-month average yield of 10-year Singapore Government Securities plus 1%, whichever is higher, reviewed quarterly. Only monies in excess of $20,000 in OA and $40,000 in SA can be invested under the CPF Investment Scheme (“CPFIS”). Please refer to the website of the CPF Board for further information. Investors should note that the applicable interest rates for the CPF accounts and the terms of CPFIS may be varied by the CPF Board from time to time.
The units of NikkoAM-StraitsTrading Asia ex Japan REIT ETF are not in any way sponsored, endorsed, sold or promoted by FTSE International Limited (“FTSE”), by the London Stock Exchange Group companies (“LSEG”), Euronext N.V. (“Euronext”), European Public Real Estate Association (“EPRA”), or the National Association of Real Estate Investment Trusts (“NAREIT”) (together the “Licensor Parties”) and none of the Licensor Parties make any warranty or representation whatsoever, expressly or impliedly, either as to the results to be obtained from the use of the FTSE EPRA/NAREIT Asia ex Japan Net Total Return REIT Index (the “Index”) and/or the figure at which the said Index stands at any particular time on any particular day or otherwise. The Index is compiled and calculated by FTSE. However, none of the Licensor Parties shall be liable (whether in negligence or otherwise) to any person for any error in the Index and none of the Licensor Parties shall be under any obligation to advise any person of any error therein.
“FTSE®” is a trade mark of LSEG, “NAREIT®” is a trade mark of the National Association of Real Estate Investment Trusts and “EPRA®” is a trade mark of EPRA and all are used by FTSE under licence.
Quite amazed to find that India has a high allocation of 6.5% in the Apac REIT ETF. If you are from India you will know, India REIT market is at its infancy only 2 or 3 listed REITs in the exchange. Indian REITs are atleast 30 years behind compared to Singapore when comes to evolution. So it is quite striking to see such a high exposure.
That’s a good point actually.
Not necessarily a bad thing though.
Hello FH,
Any idea why does this Nikko reit etf exclude Japan? Any official words from Nikko folks?
Thank you
This is an Asia ex Japan REIT ETF. So the mandate excludes Japan.
Although if you’re asking why not include Japan in the mandate. In which case I suppose the answer is that Japan being the largest REIT market in Asia, contains REITs purely focussed on Japan properties. More suitable for Japanese investors, less so for foreign investors.
I noticed of late many Reits do non-renounceable rights issues. How does NIKKO Reit deals with it since it has no “surplus” cash to subscribe for the rights which cannot be sold in the market.
Thank you.
They hold a bit of cash to meet rights issues. They also have the right to sell other positions to subscribe for the rights, to maintain the asset allocation of the REITs.
Ie. There is a little bit of discretion by the fund manager on this.