Many of you have been asking me about what tools or platforms are available to analyse stocks.
Of course, the gold standard is a Bloomberg Terminal, but that comes at $2000 a month – which makes no sense for a retail investor.
For retail investors based in Singapore / Malaysia – ShareInvestor WebPro is one of the more cost-effective tools out there in the market.
WebPro has been used in some of our previous stock analysis articles and today’s post will introduce you to some of the key features I find useful.
Note: This post was sponsored by ShareInvestor. All views and opinions expressed in this post are from Financial Horse.
Key Features of ShareInvestor WebPro
Some of the useful features of WebPro include:
- Quick Financial Overview (proprietary of ShareInvestor)
- 10 years of Financial Data across 7 markets
- Analysts’ Consensus Estimates
- Dividend Analysis
- Insider Buying/Selling Activity
- Ownership
- Charting Tool
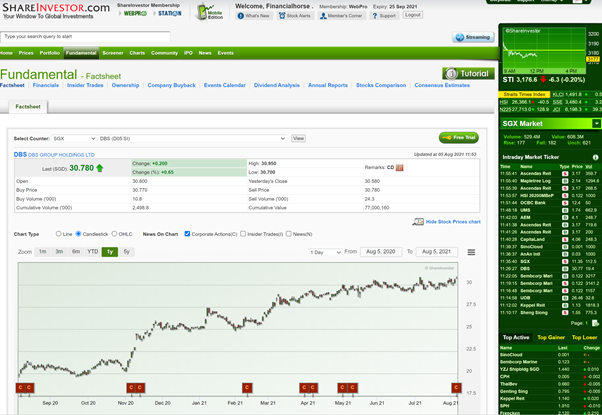
I’ll run through the features using a sample stock – DBS Group, so you can get an idea of how to use it to research a stock.
Step 1. Quick Financial Overview (proprietary of ShareInvestor)
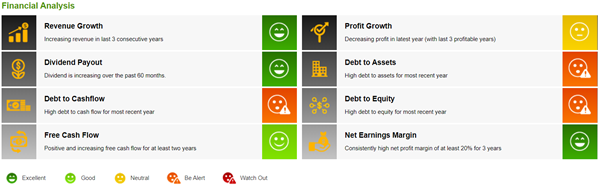
This is ShareInvestor’s proprietary feature allows investors to have a quick overview of a stock.
There is a smiley face legend at the bottom which showcases the different ratings – from ‘Excellent’ to ‘Watch Out’.
The chart above showcases DBS’ financial overview at a quick glance.
According to the chart, revenue growth and dividend pay-out has been increasing – as symbolized by the green smiley faces. As for the 3 orange smiley faces, they pertain to high debt ratios but of course, the context of DBS being a bank has to be taken into account.
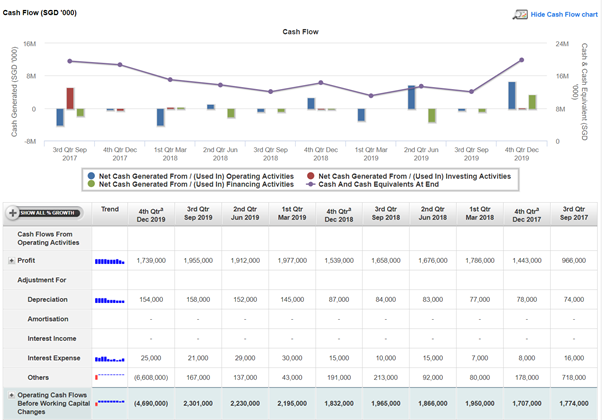
Step 2. Financial Data
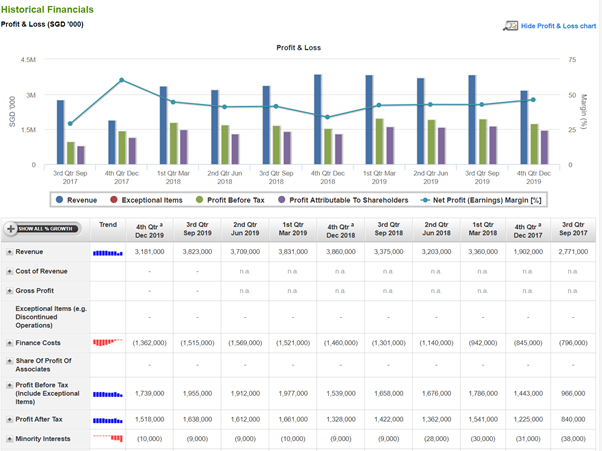
Financial Data saves you a ton of time in having to dig up all the historical financial statements.
You can see records from up to 10 years back, and you can display them quarterly or yearly (up to 10 periods at one go).
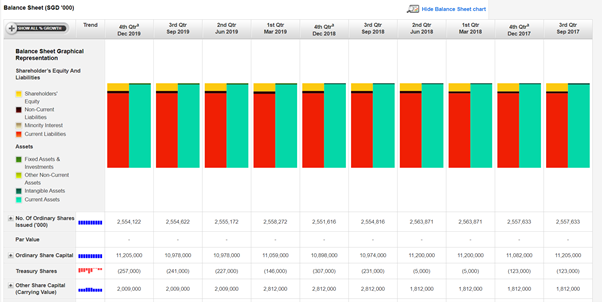
You can also display them visually like the below, which gives you a great way to visualise the longer term trends for P&L.
You can do the same thing for both balance sheet and cash flow as well.
This genuinely saves a lot of time – if allows you to get the big picture view, and then decide on which area you want to drill down into.
Yahoo Finance has the same feature but it’s much more limited.
Step 3. Analysts’ Consensus Estimates
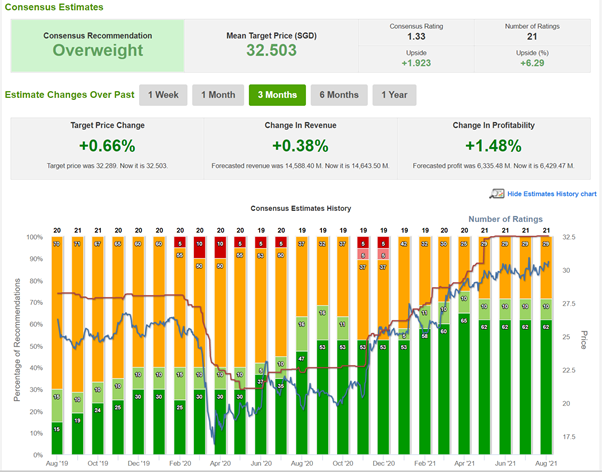
ShareInvestor Webpro also very conveniently summarises the analyst consensus estimates for you.
You can track what average analyst recommendation – including how it changes over time, which is a great feature.
From the chart above, 21 analysts have given DBS Group an Overweight recommendation, with an average target price of S$32.50. In the past 2 years, the analysts’ target price (brown line) and DBS share price (blue line) have moved in tandem – crashing below S$20 during the height of the pandemic and rebounding to cross S$30 in the month of August 2021.

The analysts also shared their projection of the 3 years forward estimates across revenue, balance sheet and financial ratios
Step 4. Dividend Analysis
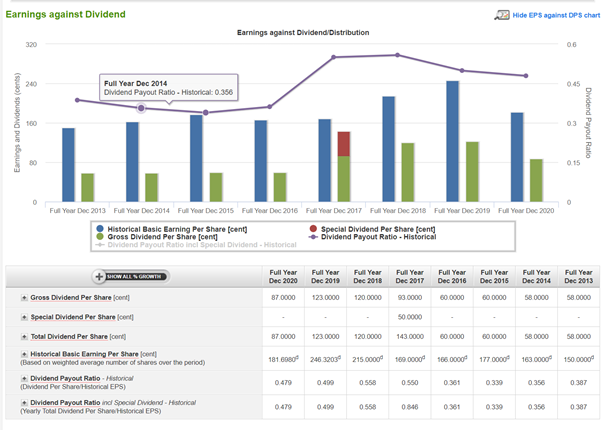

Another unique feature is the Dividend Analysis tool.
It allows you to analysis the dividend trend of the company using financial Charts and their historical distribution.
In this case, we can see that DBS dividend has been unstable, and has been cut more than once over the past 4 years.
Step 5. Insider Selling/Buying Activities
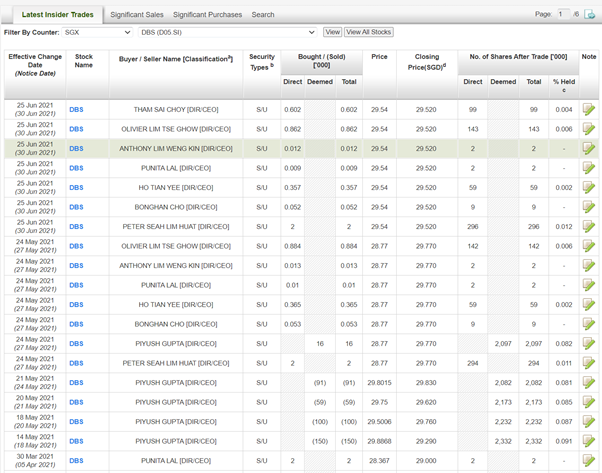
Insider selling/buying is another feature that is extremely useful.
Without this, you need to manually trawl through each SGX announcement to piece together the picture of what insiders are doing.
Which is a ton of work, trust me.
With ShareInvestor Webpro – it’s all summarised very neatly for you. With one glance, you can see whether insiders are selling or buying:
In this case of DBS, you can see a continual track record of insiders buying, which may be interpreted as a vote of confidence from management.
Step 6. Ownership
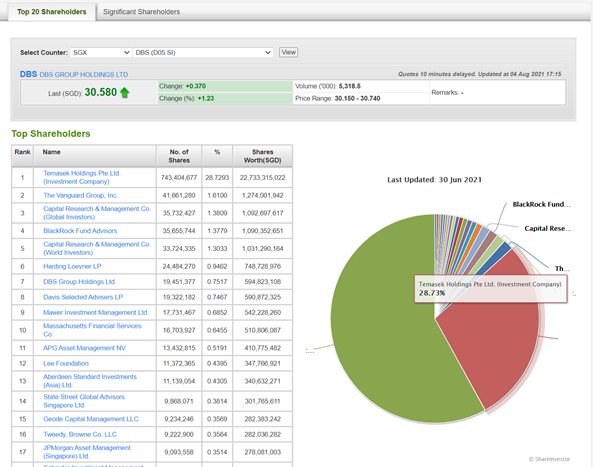
The list of the top substantial shareholders is another useful tool.
From the chart above, we can see that Temasek Holdings is the biggest shareholder of DBS with a sizable 28.7% stake.
The alternative is to go and pull up the annual report of the company. But having it in ShareInvestor WebPro (together with all the other features above) is very convenient.
For most of my research on Singapore stocks, I usually make Webpro my first port of call, in order to get this kind of high-level overview of the company.
Step 7. Charting Tool – C2 Chart
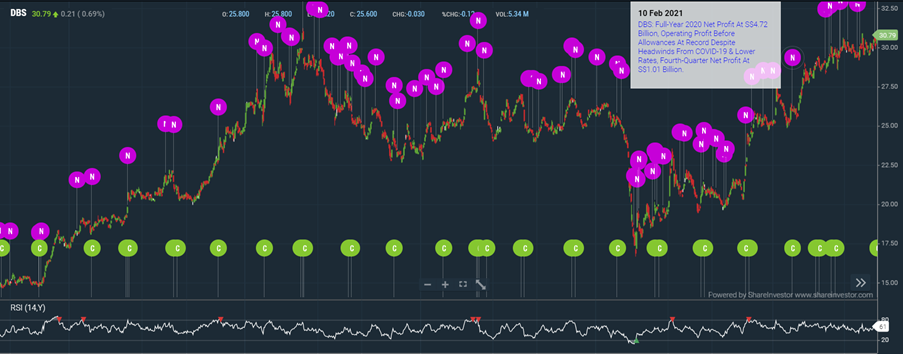
ShareInvestor WebPro has a great charting tool as well – great if you want to do technical analysis, or check out the technical indicators like MACD or RSI.
In addition, you can also insert company specific events such as news, corporate actions, and insider activities into the chart itself.
Competitive Pricing
And of course, pricing for WebPro is incredibly competitive.
The basic pricing for ShareInvestor WebPro is set out below.
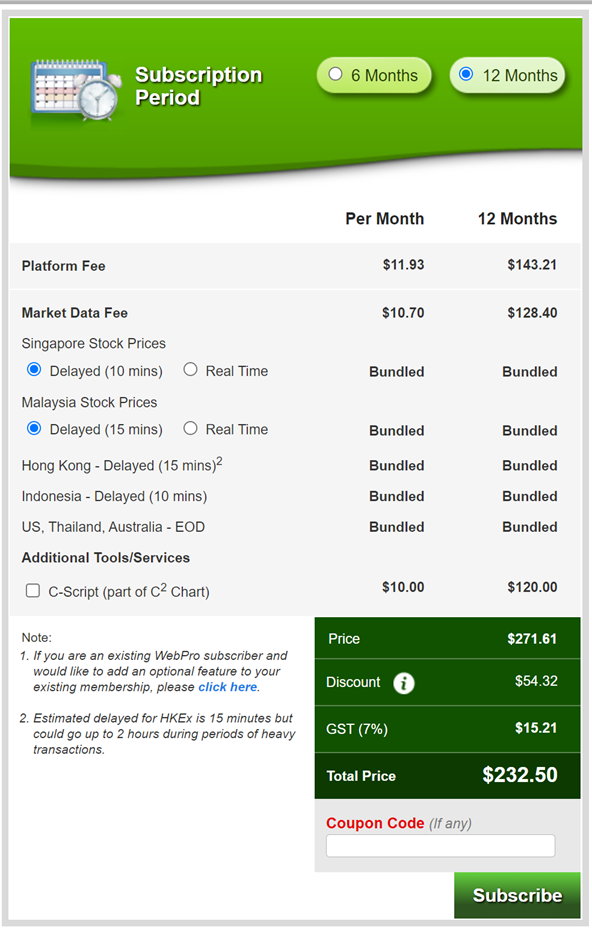
It works out to about $20 a month, which is significantly cheaper than most other institutional tools out there.
Sign up for WebPro (August Promo!)
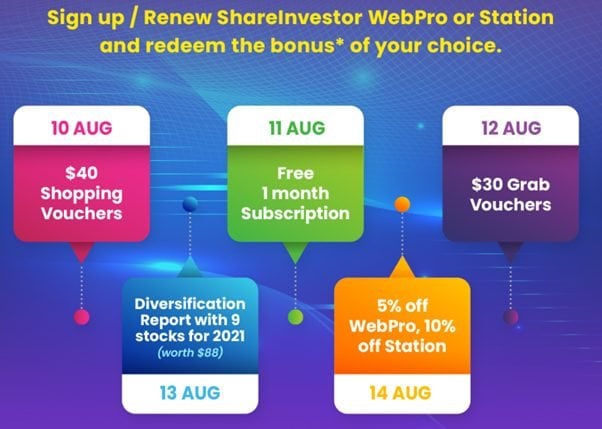
ShareInvestor is running an exciting promotion between 10 – 14 August.
To be eligible for the specific bonus of your choice, there will be a specific promo code for each day.
This will be a limited time offer so don’t miss out. Find out more here!
Closing Thoughts
For Singapore / Malaysia investors who want something more advanced than the free tools like Yahoo Finance, but are not willing to shell out for institutional tools like a Bloomberg terminal, ShareInvestor Webpro is one of the best solutions out there – at a very competitive price point too.
You get a ton of tool for both fundamental and technical analysis, all consolidated in one location, which just saves you a huge amount of time.
For me personally, whenever I’m researching a new Singapore stock, I’ll usually start with (1) ShareInvestor Webpro, then (2) go into the company financial results, and (3) do a broad google search for latest news and developments with the company.
I find this gives me a broad overview of the company, and allows me to identify the red flags that I would need to do more search into.
If you’re looking for a tool to supplement your stock research, ShareInvestor Webpro is well worth looking at.
Note: This post was sponsored by ShareInvestor. All views and opinions expressed in this post are from Financial Horse.
Follow Financial Horse on Social Media for more investing content!