
In my previous review of StashAway (Part I and Part II), I commented that one of my main gripes with StashAway was their heavy allocation to US bonds, which from the perspective of a Singapore investor, was not very attractive due to withholding tax and forex issues.
It seems that StashAway has taken this comment on board, because this past week, they reached out to inform that they have introduced a new “High Risk” Portfolio that does not include US Bonds. A number of readers have also reached out to ask about my thoughts on this, so I felt it was only fair that I refreshed my original review to take into account this development.
Basics: StashAway’s “High Risk” Portfolio
StashAway now gives you the option to take on higher risk and gain exposure to a pure equity portfolio.
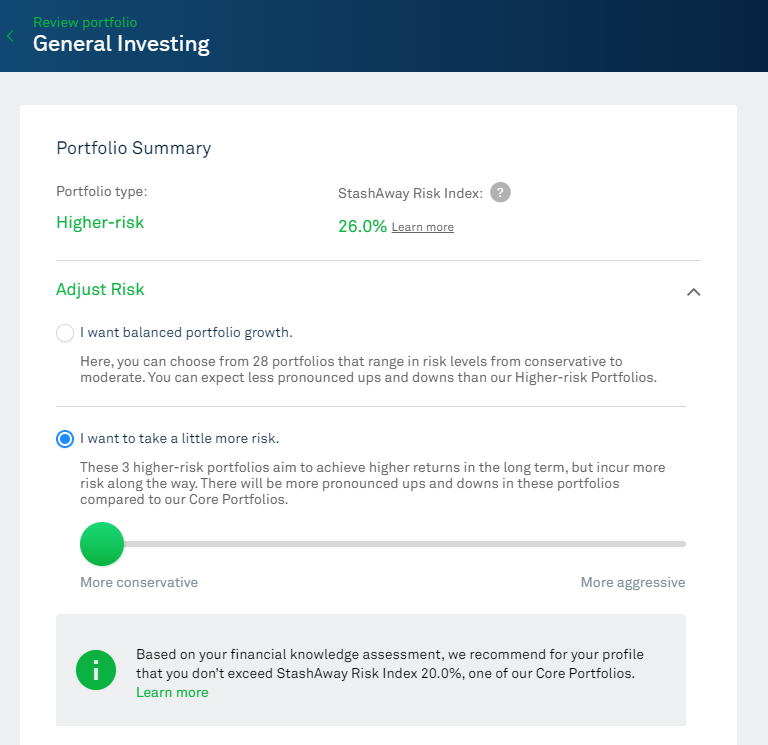
There are 3 tiers you can select from, as set out below
Tier 1 (least risky)
Asset Allocation
| FIXED INCOME | TICKER | WEIGHT | |
| iShares TIPS Bond ETF | TIP | 7.13% – 10.69% |
| US EQUITIES | TICKER | WEIGHT | |
| Consumer Discretionary Select Sector SPDR Fund | XLY | 12.67% – 19.01% | |
| Consumer Staples Select Sector SPDR Fund | XLP | 11.88% – 17.82% | |
| Vanguard Small-Cap Growth ETF | VBK | 11.88% – 17.82% |
| CASH | TICKER | WEIGHT | |
| Cash | SGD | 0.80% – 1.20% |
| HYBRID | TICKER | WEIGHT | |
| SPDR Bloomberg Barclays Convertible Securities ETF | CWB | 11.88% – 17.82% |
| ASIA EX JAPAN EQUITIES | TICKER | WEIGHT | |
| iShares MSCI All Country Asia ex Japan ETF | AAXJ | 11.88% – 17.82% |
| COMMODITIES | TICKER | WEIGHT | |
| SPDR Gold Trust | GLD | 11.88% – 17.82% |
Tier 2
Asset Allocation
| FIXED INCOME | TICKER | WEIGHT | |
| Vanguard REIT ETF | VNQ | 5.15% – 7.73% |
| US EQUITIES | TICKER | WEIGHT | |
| Consumer Discretionary Select Sector SPDR Fund | XLY | 11.88% – 17.82% | |
| Consumer Staples Select Sector SPDR Fund | XLP | 10.69% – 16.03% | |
| Technology Select Sector SPDR Fund | XLK | 3.96% – 5.94% | |
| Vanguard Small-Cap Growth ETF | VBK | 11.88% – 17.82% |
| CASH | TICKER | WEIGHT | |
| Cash | SGD | 0.80% – 1.20% |
| HYBRID | TICKER | WEIGHT | |
| SPDR Bloomberg Barclays Convertible Securities ETF | CWB | 11.88% – 17.82% |
| ASIA EX JAPAN EQUITIES | TICKER | WEIGHT | |
| iShares MSCI All Country Asia ex Japan ETF | AAXJ | 11.88% – 17.82% |
| COMMODITIES | TICKER | WEIGHT | |
| SPDR Gold Trust | GLD | 11.88% – 17.82% |
Tier 3 (most risky)
Asset Allocation
| FIXED INCOME | TICKER | WEIGHT | |
| Vanguard REIT ETF | VNQ | 11.88% – 17.82% |
| US EQUITIES | TICKER | WEIGHT | |
| Consumer Discretionary Select Sector SPDR Fund | XLY | 11.88% – 17.82% | |
| SPDR S&P 500 Trust ETF | SPY | 4.75% – 7.13% | |
| Technology Select Sector SPDR Fund | XLK | 11.88% – 17.82% | |
| Vanguard Small-Cap Growth ETF | VBK | 11.88% – 17.82% |
| CASH | TICKER | WEIGHT | |
| Cash | SGD | 0.80% – 1.20% |
| HYBRID | TICKER | WEIGHT | |
| SPDR Bloomberg Barclays Convertible Securities ETF | CWB | 11.88% – 17.82% |
| ASIA EX JAPAN EQUITIES | TICKER | WEIGHT | |
| iShares MSCI All Country Asia ex Japan ETF | AAXJ | 11.88% – 17.82% |
| COMMODITIES | TICKER | WEIGHT | |
| SPDR Gold Trust | GLD | 3.17% – 4.75 |
US REITs?!
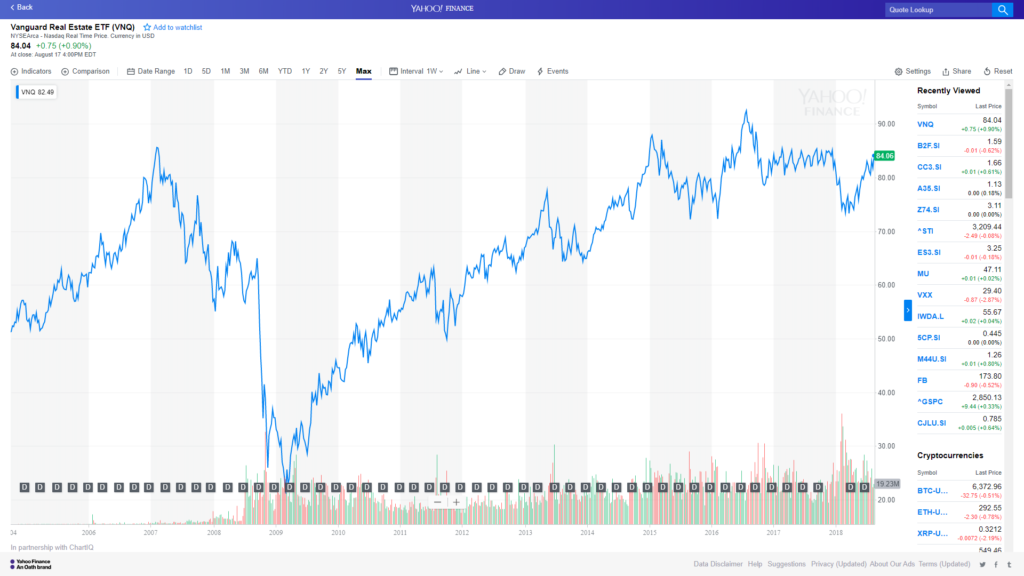
The first thing that came to my mind when I saw the portfolio was “US REIT ETF?!” After all, US REITs are subject to a 30% withholding tax on their dividends, which is quite ridiculous when the whole point of investing in REITs is for the juicy dividend. The ETF they selected (VNQ) currently trades at about a 3.56% dividend yield, so after withholding tax that’s about a 2.5% yield. Definitely not ideal, and I’m quite surprised this went in over an S-REIT.
I suppose the argument can be made that it’s not just about the yield, it’s about capital gains as well. If we look at the longer term chart for VNQ, we see that US real estate has indeed enjoyed very nice capital gains since the financial crisis.
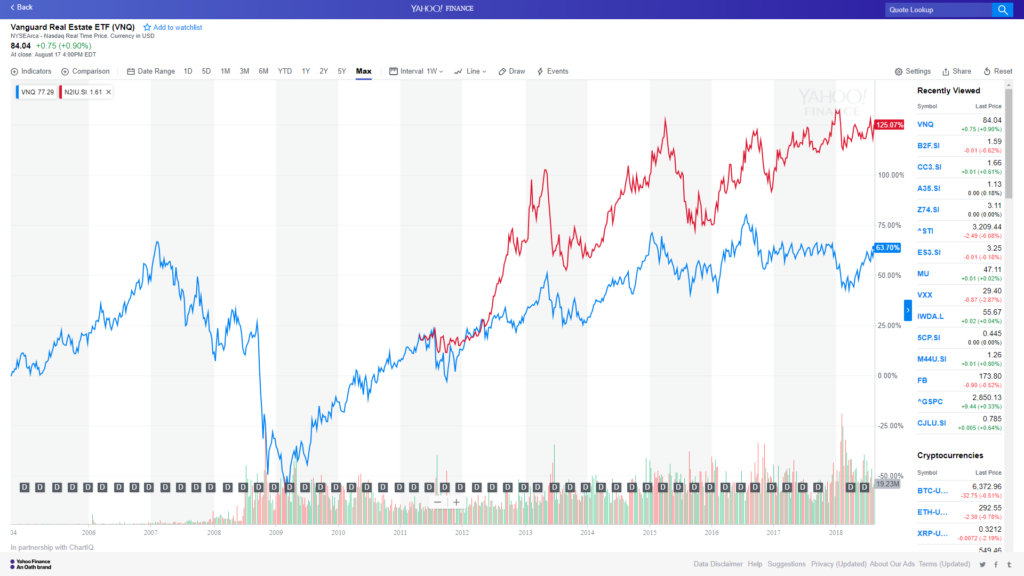
Unfortunately though, the same has happened for real estate globally, as the US Federal Reserve’s quantitative easing and cheap money from the European and Japanese central banks have inflated global asset prices. To illustrate, I benchmarked the VNQ against Mapletree Commercial Trust, one of my favourite REIT, plotted in red below. The capital gains are equally, if not more impressive than VNQ, and don’t forget all this is before counting the dividends. After counting dividends and factoring in the lack of withholding tax, I’m pretty sure you’d be better off with a bunch of blue-chip S-REITs, historically speaking.
The other argument that can be made is that the REIT ETF’s price correlation with the rest of portfolio is such that it will serve to smooth out losses in other asset allocations, reducing the overall portfolio volatility. That’s a far more sophisticated argument, and to test that, I backtested the allocations.
Backtested performance
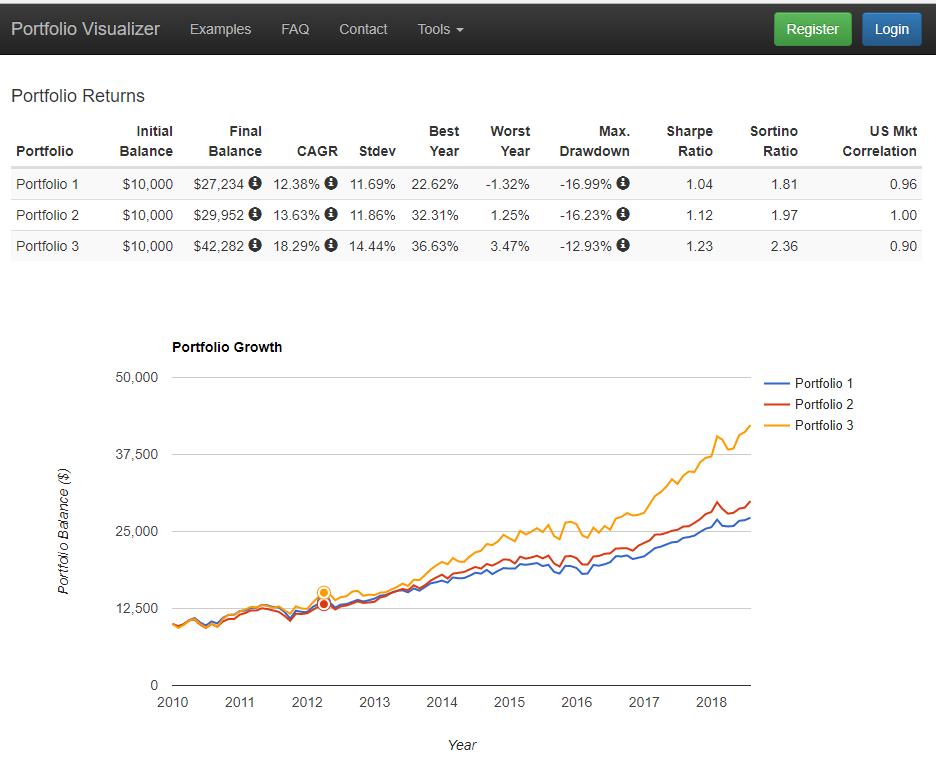
Here are the backtested returns, with Portfolio 1 being StashAway’s highest risk portfolio, Portfolio 2 being the S&P500, Portfolio 3 being the tech heavy Nasdaq ETF (QQQ). A couple of assumptions I made in backtesting:
- Reoptimisation Regime – StashAway has a complex tactical reoptimisation strategy, where they tweak asset allocations depending on what they believe to be the stage of the economic cycle we are in. It’s why their asset allocations are expressed as a range. Without knowledge of how their reoptimisation works, it’s not possible to do a true backtesting. For current purposes, I simply assumed the average of the range (if you take a look at StashAway’s own backtesting at the end of this article, they also had to make similar assumptions).
- Starts from 2010 – Unfortunately the Barclays Convertible Securities ETF (CWB) that StashAway uses only goes back to 2009. It’s a huge shame because the stock market has been on a bull run since 2010, and I really wanted to see how this portfolio performed during a recession. I could swap out the CWB for what I think would be an accurate proxy, but I don’t think would be fair, and the simulation would lose its meaning.
With that out of the way, here are my observations:
- Underperforms the S&P500 – You would have thought that the higher risk portfolio would basically track the S&P500 performance. But it doesn’t. It actually underperforms the S&P 500 quite a bit, 12.38% annual returns vs 13.63% for the S&P500. The max drawdown is even higher, and the Sharpe ratio is not as high. Don’t forget that this is before taking into account StashAway’s fee. Which just leads to the conclusion that starting from 2010, this asset allocation simply underperforms the simple S&P500. Which begs the question, why not just buy the S&P500 if all you want is a high risk portfolio?
- Underperforms the Nasdaq – If we compare this against the Nasdaq ETF (QQQ), the underperformance is much starker, 12.38% vs 18.29%. To be fair, I don’t think the Nasdaq is a good benchmark, because it has really been an unbelievable runup in tech, and anyone who bought the Nasdaq 10 years back would have outperformed just about every other hedge fund out there.
Forward performance
The thing about backtesting, is that it’s inherently backward looking. What asset classes performed well in the past, may not perform well in the future. Just because the Nasdaq outperformed the S&P the past 10 years, does not mean it will outperform the next 10 years. I suppose an argument can be made here that StashAway’s “High Risk” portfolio would outperform the S&P500 going forward. Unfortunately, I just don’t know how to test that statement without the power of foresight.
If we take a closer look at their allocation, it’s basically split as follows:
- REIT ETF
- Consumer Discretionary ETF
- S&P500
- Tech ETF
- Small Cap Growth ETF
- Convertible Securities ETF
- MSCI Asia ex Japan ETF
- Gold ETF
It’s a very diverse, broad exposure to the US economy. I suppose I can come up with 10 reasons why this will outperform the S&P500 in the next 5 years, and another 10 reasons why it will underperform. But that doesn’t change the fact that at the end of the day, no one truly knows how this portfolio will perform.
The market doesn’t respond well to pigeonholing
The problem what this categorisation, is that it implies that with the Tier 3 highest risk portfolio, you will be getting higher returns. But after looking at all 3 high risk portfolios, I felt that this wasn’t 100% clear to me. Given how complex and subtly different these asset allocations are, I think there is a high possibility that one of the 3 will outperform the other going forward, and it may or may not be the highest risk one.
It’s easy to get carried away with StashAway’s very impressive platform, and get lulled into a false sense of security to think that by clicking on the highest risk button you are going to get the best possible returns. But there’s no getting around the fact that you are still investing in the US market, and exposed to its whims and fancies. When trump releases another tweet against China, and the market plunges, no one can tell you which asset class is going to fall more than another.
All very interesting Financial Horse, but would you invest?
After all that talk, the most important question: “Would I invest?” And that’s a tricky question, because my risk profile and financial objectives may differ from my readers. But putting aside all that, I don’t think I would invest in this “Higher Risk” Portfolio. The problem with StashAway for me, is that their asset allocation is just so diverse, because it is intended to be a one stop shop for investing. And that’s perfect for young millennial investors who just want to park their money somewhere and gain exposure to the market, without having to worry about it too much.
But I love investing. All I read about is financial news. If you took investing away from me, I wouldn’t know what to do in my free time (perhaps I’ll start a law blog…). If I invest in StashAway’s Higher Risk portfolio, I would use it purely for the US portion of my portfolio, and I would still have to continue to pick Singapore shares and REITs. That becomes very tricky for me, because I need to fully understand StashAway’s asset allocation, and how it impacts the risk profile of the rest of my portfolio. For example if StashAway is heavily weighted towards US REITs, I may need to dial back on my S-REITs, otherwise my portfolio as a whole would be too exposed to global real estate. And that’s a lot of work, which detracts from the entire purpose of a robo to begin with.
Closing Thoughts
I think Michele (the CEO) is absolutely right that these “Higher Risk” portfolios definitely expand StashAway’s offerings very significantly. One of my original gripes with their platform was the inability to gain exposure to 100% equities, and it appears that has been addressed. If you are a diehard StashAway fan, and you want to take on a higher risk profile, this is a pretty good choice. If you are more of a neutral, I felt that StashAway hadn’t fully shown how these portfolios would outperform a simple S&P500 or Nasdaq ETF, both historically and going forward. Holistically speaking, I don’t think the risk you are taking on with StashAway would be higher than that the S&P500, so it’s okay to give it a shot if you want to give it a try, but do go in with your eyes open, and understand that there’s really no guarantees in investing.
However if after this article your decision is to invest with StashAway, then please sign up through this referral link to enjoy 50% off on your first S$50,000 investment for 6 months, which works out to about S$94.
For background, I’ve also set out the information that StashAway sent to me, presented without commentary.
A) SOME DETAILS ON OUR NEW PORTFOLIOS
New higher-risk portfolios 1-year backtest results
The portfolios have the same risk (average daily volatility from January 2008 to December 2017) as Equity-Bond 75-25, 90-10, and 100-0. We backdated the portfolios, and the 1-year (19 July 2017 – 18 July 2018) gross performance since our launch date is 9.2%, 10.3% and 10.4% in USD (and 9.0%, 10.1% and 10.2% in SGD).
New higher-risk portfolios 10-year backtest results
We also backdated the portfolios over a 10-year period (January 2008 – December 2017, so starting just before the crisis), and our higher-risk portfolios performed with 8.2%, 8.8%, 8.9% returns in USD. Our risk benchmarks (Equity-Bond of 75-25, 90-10 and 100-0) achieved in the same period returns of 5.1%, 5.5% and 5.7%, respectively. Another point of comparison is the STI in the same period: it earned returns of 3.8%. Please note that these returns exclude the benefit of reoptimisation. In other words, the portfolios were backtested as if we were in “Regime B” (Good times) for the entire 10-year period, even the recession). Generally, reoptimisation adds 1-2pp/year and reduces volatility/risk.
Why the new portfolios?
…because it’s what many customers and potential customers were asking for. This addition significantly broadens our offering, as our currently highest risk portfolio (P28) is equivalent to a 53%Equity-47%Bonds. This current max equity allocation is significantly lower-risk than other investment options currently available in the Singapore market. We initially did this by design to emphasise our risk-management approach. Yet, quite a few customers have asked us for the opportunity to invest in higher-risk portfolios. To address the demand, we’ve added these portfolios. Obviously, these portfolios should only be invested in with a very long-term view, as they will have some significant short-to-medium term swings. As always, to protect our customers, only investors with sufficient knowledge and expertise will be given access to these portfolios; our customer support team is always happy to help customer prove their expertise if the initial financial assessment does not allow them to demonstrate their financial knowledge.
B) SOME DETAILS ON OUR FIRST 12 MONTHS PERFORMANCE
(this is data we went to all of our customers – I’m sending it in case you do not receive our newsletter)
The First Year’s Returns
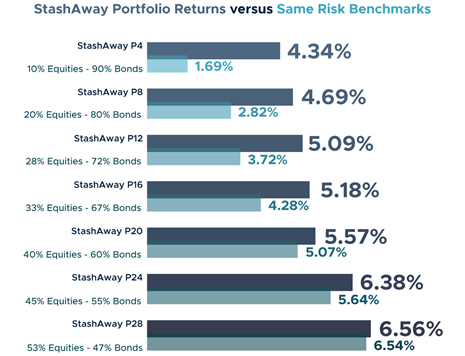
The chart below shows gross returns in SGD of these portfolios, ranked by risk (low to high), compared to the returns of their respective risk-based benchmarks. Same-risk benchmark are defined looking at 10 years volatility (Jan 2008-Dec 2017); “Bonds” are proxied with FTSE World Govt Index while “equity” is proxied with MSCI World Index. So for example, our P4 in the last 10 years has shown the same average daily volatility of a basket of 10% MSCI World Index and 90% FTSE World Govt Index; in the last 12 months P4 has given gross returns in SGD of 4.34% while the same-risk benchmark has returned 1.69%.
From our launch on 19 July 2017 to the 18 July 2018, our portfolios have yielded between 4.3% and 6.6% gross returns in SGD, characterised by a very positive market for the first 7 months (July 2017 to January 2018) and a more turbulent one for the subsequent 5 months (February 2018 – present). All of StashAway’s 28 portfolios have outperformed their same-risk benchmark.
In the same timeframe, an investment in the Straits Times Index (STI) would have yielded only 0.8% positive returns. Note that the risk of the STI is approximately 2x the risk of P28 over the last 10 years.
Source: Bloomberg, StashAway analysis
The Weekly Horse
All Financial Horse does in his free time during the week is read financial news. With this new initiative (“The Weekly Horse”), hopefully some good can come out of it. During the week, I post articles that I enjoyed on the Facebook Group (do join if you want a sneak peak), and every Sunday I will collate the links for readers. I also take the opportunity to address queries from readers, or share any thoughts that I have for the week. If you enjoyed this post, do share your thoughts in the comments below!
Enjoyed this article on the importance of discipline in any venture that you undertake.
Across performance activities we can see that disciplined performance is a necessary phase of development. The basketball or football player learns to follow a game plan, not just do what they feel like doing. The poker player learns to fold when the cards aren’t right. It’s common for developing psychologists to learn their craft from manuals that are research-validated and that give them a game plan for helping people with various problems. Discipline is all about sublimating the ego to sound rules and principles.
https://traderfeed.blogspot.com/2018/08/from-discipline-to-professionalism-in.html?m=1
None of us are professional portfolio managers here, but the lessons here, on the importance of controlling your behaviour and attitude, are relevant for all investors.
https://blogs.cfainstitute.org/investor/2018/08/06/tips-for-aspiring-portfolio-managers/
I don’t usually do midweek posts, but I decided to make an exception for SPH and their INVEST Fair 2018. It’s basically the PC Show equivalent for investing, so do check it out if you are keen, because more knowledge never hurt anyone. If you sign up using FinancialHorse as a promo code, you’ll triple your chances at the lucky draw.
https://financialhorse.com/invest-fair/
Shared by a reader:
Where to invest $10,000 right now?
https://blog.seedly.sg/singaporean-guide-where-to-invest-10000-right-now/
Continuing with the theme of “behavioural alpha” this week, here’s another great article on how the widespread availability of information, means that the only way to outperform is by controlling your own emotions and behaviour.
https://ofdollarsanddata.com/we-all-have-it-now/
Shared by a reader
Interesting that Temasek is bailing out of US banks just when the US economy is still strong and US interest rates is still hiking. Instead they are shifting to Fin-Tech-especially E-payment type. On a surprising note, Chinese bank remains a priority instead (even when they face constant theat of non performing loans as the govt constantly flip-flop between tightening and loosening lending to curb leverage). How to read this?- A show of declining confidence in the US economy as would think the performance of banks tend to reflect the health of an economy?
Great read on the background to the EM currency contagion. If you only read one article this week, it should be this.
https://www.themacrotourist.com/posts/2018/08/15/contagion/
Read this with a healthy pinch of salt, and perhaps you might find this an interesting alternative to the mainstream narrative behind China’s depreciation of the yuan.
https://dailyreckoning.com/chinas-plan-to-tank-their-own-stock-market/
Financial Horse has a set of 7 Commandments for Successful Investing, that I ask myself before making every investment, and that I will never break regardless of the situation. Enter your email below to receive a copy in your inbox!
[mc4wp_form id=”173″]
Enjoyed this article? Like our Facebook Page for more great articles, or join the Facebook Group to continue the discussion!
(disclaimer: I am the Co-Founder and CEO of StashAway)
Financial Horse,
Thank you very much for looking at StashAway’s newest product update and for talking about it!
I am writing here as your analysis is lacking key pieces of information, and I would like to offer a more holistic analysis based on a wider data set:
1) On the backtest vs S&P500 and NASDAQ: your backtests only start in 2010 and therefore you have only tested “bull market” performance of the 3 portfolios. This is like testing a race-car only in a long straight, rather than on turns too! Sooner or later the road (and the markets) will turn, and that’s where a non-optimized car setup (or portfolio) can produce real damages. This is why we provided our customers and you with data on the backtests including the 2008 Global Financial Crisis. In the 10 years from Jan 2008 to Dec 2017, StashAway’s new highest risk portfolio returned 8.9% yearly, outperforming its benchmark (MSCI World Equities Index) by 3.3%/annum; during the same period the portfolio has also beaten the US Large Cap Equities (S&P500) by 0.5%/annum while also providing significantly more diversification across geographies, currencies and asset classes.
2) On US REITs: US REITs can be a significant contributor to overall returns, mostly through capital gains, and have the added advantage of providing some diversification to a full-equity portfolio.
a) “the whole point of investing in REITs is the juicy dividends” is a very strong simplification. VNQ tracks US REITs which is an asset class that returned an average of 16.7% per annum in “Good Economic Times” over the last 30 years, and on average only 4% came from dividends (less than 25%). Optimizing your REITs selection looking at withholding taxes that impact approx 1.2% annual return (30% of 4%) over a 16.7% average, means to make a decision based on 7% of the data (1.2/16.7), and not looking at the remaining 93%. During our thorough ETF selection and portfolio optimization processes, we look at net returns after withholding taxes, so you can rest assured that the effect of taxes is taken into account when selecting the instruments we use and when we decide allocations. For clarity, the reason I am using data from “good economic times” is that the portfolios you are analyzing are optimized for ERAA’s “Regime B” (Good Economic Times”, because that’s where we are today.
b) On diversification: VNQ has a lower correlation to US Large Cap market (S&P 500) than both geographic diversification or sectorial diversification can provide. For example, while AAXJ (Asia ex-Japan equities) gives exposure to one of the least correlated markets to the S&P 500, it still shows a 64% correlation to it. VNQ shows a lower correlation to S&P 500 across economic regimes at 51%..
c) You say that you are “pretty sure you’d be better off with a bunch of blue-chip S-REITs, historically speaking.” Unfortunately ETFs tracking Singapore-based REITs are very recent and therefore are difficult to compare. You went on the approach of selecting a single-name REIT. By definition, you will always be able to look back and find single-name stocks (or REITs, in this case) that beat industry benchmarks. For example, if you invested in August 1998 in Amazon shares, you would have made more than 100x returns in 20 years and there’s no index that can beat it: is this a good reason not to invest in the S&P 500 or even the STI today? I doubt it.
I hope the clarifications above help you and your readers make informed investing decisions!
Happy investing!
Michele Ferrario
Hi Michele,
Thanks for dropping by! I am hugely honoured.
A few quick points:
1. Some of the ETFs that StashAway uses were only created in 2008, so the 15 year backtested results are using proxies. I had intentionally avoided using proxies in my backtesting to avoid selection bias.
2. Your number on VNQ are in “Good Economic Times”, which to use your analogy, is like testing a race-car only on a long straight! The annualised returns for the VNQ since inception are 7.4%.
3. I do agree that there’s no easy benchmark for blue chip S-REITs, which historically speaking, are a relatively recent development (past 10 to 15 years). However if you were to take a sample benchmark of all the CapitaLand and Mapletree REITs and bought them since their IPO, they would still outperform the VNQ. Of course, whether that will hold true going forward is anyone’s guess.
But that said, I do agree with you that StashAway’s portfolio is far more diversified than the S&P500. On that basis, it should theoretically outperform the S&P500 in a bear market, although that said, the markets have a habit of making fools out of such predictions!
Thanks again for dropping by, I am sure this exchange would help readers greatly. 🙂
Was drawn into StashAway for CPF SRS funds as it’s one of the instruments that
A. No “one-time” fee
B. No lock-in period
Comparatively, if one is keen for US equity exposure against traditional unit trusts the fees are a no brainer
Against the usual RSPs e.g. POSB investsaver/OCBC BCIP who only provide SG equity exposure and fees are comparatively higher as well
Personally like you mention would not invest cash into stashaway, but seeing that (personally) already 11.5% up tax gains wise, there can be worse options than stashaway for SRS monies. Endowus has lower fees for SRS at 0.4% and that may be something to consider as well, currently looking into that. Although at the moment still enjoying the “free” management from stashaway ?
True, that’s an interesting way to use StashAway, especially if you can get the free management.