Over the past week, I have heard the yield curve being mentioned 3 times. The first was for a board meeting for a listed company, which I suppose would represent sophisticated investors. The second was by a retail investor, who was musing over the impact of the impending yield curve inversion. And the third was by a colleague who did not invest at all, but was wondering what this “inversion” means for the economy.
And suddenly, that got me very worried indeed. There’s a famous story about how Joseph Kennedy decided to sell all his stocks in 1929 when he started getting stock tips from a shoeshine boy. Today, it seems like even the “shoeshine boy” is talking about how a “yield curve inversion” will trigger an upcoming recession, which by a contrarian logic, would mean the exact opposite wouldn’t it?
Basics: What is the yield curve?
Business Times has a great summary of the yield curve:
The yield curve is basically the difference between interest rates on short-term US government bonds, say, two-year Treasury notes, and long-term government bonds, such as 10-year Treasury notes.
Typically, when an economy seems in good health, the rate on the longer-term bonds will be higher than short-term ones. The extra interest is to compensate, in part, for the risk that strong economic growth could set off a broad rise in prices, known as inflation.
Lately, though, long-term bond yields have been stubbornly slow to rise – which suggests traders are concerned about long-term growth – even as the economy shows plenty of vitality.
At the same time, the Federal Reserve has been raising short-term rates, so the yield curve has been “flattening”. In other words, the gap between short-term interest rates and long-term rates is shrinking.
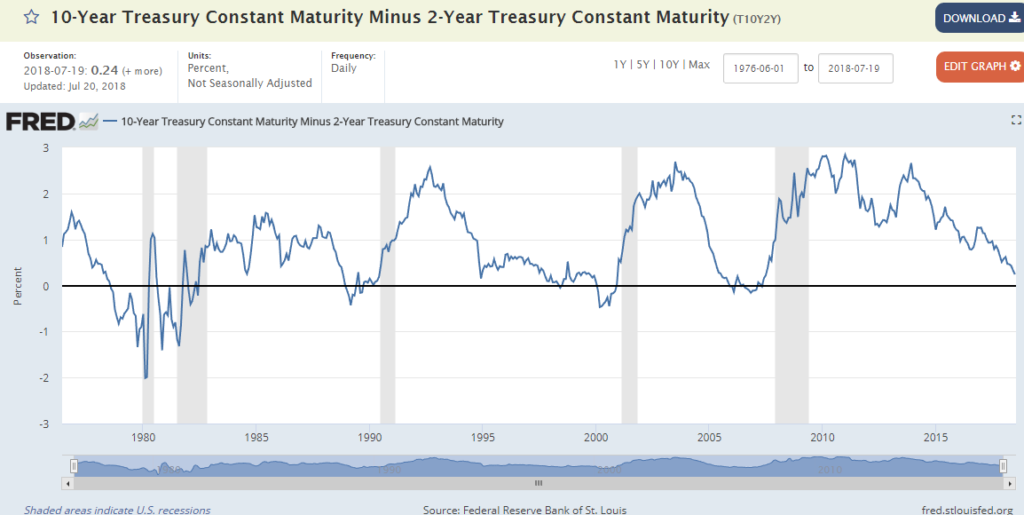
The US 2s10s yield curve is available at here, and I have also reproduced the chart below. The current 2s10s spread is 0.24, which is getting pretty close to an inversion.
The yield curve matters because:
Every recession of the past 60 years has been preceded by an inverted yield curve, according to research from the San Francisco Fed. Curve inversions have “correctly signalled all nine recessions since 1955 and had only one false positive, in the mid-1960s, when an inversion was followed by an economic slowdown but not an official recession”, the bank’s researchers wrote in March.
Why does a yield curve inversion precede a recession?
The tricky thing about the yield curve, is that no one can prove a causal link between yield curve inversion and a recession. We know that historically, every recession in the past 60 years is preceded by an inverted yield curve. What we don’t know, if whether this is merely a positive correlation, or if the yield curve inversion causes the recession.
One orthodox theory is that a yield curve inversion makes it harder for banks to borrow long term and lend short term, so credit in the economy freezes up, causing a recession. While this makes sense, it is more of a symptom rather than a cause, because it doesn’t answer the question on why long term interest rates are so low.
Another reason, as reported by the Business Times, is that: “Typically, when an economy seems in good health, the rate on the longer-term bonds will be higher than short-term ones. The extra interest is to compensate, in part, for the risk that strong economic growth could set off a broad rise in prices, known as inflation.” In other words, when the market as a collective thinks that long term inflation will slow down, it prices that into longer-term bonds. Given that the market reflects the collective group-think of all investors in the market, the market is usually right, and there is eventually a recession. Again, this looks like a symptom rather than a cause, because it doesn’t identify the underlying reason why the market expects inflation to slow down.
So the orthodox theories leave me thinking that the yield curve inversion is merely a symptom of a deeper underlying problem in the economy. It is a canary in a coal mine:
A lot time ago, miners would carry caged canaries down into the mine tunnels with them. If dangerous gases such as carbon monoxide collected in the mine, the gases would kill the canary before killing the miners, thus providing a warning to exit the tunnels immediately.
Applying the analogy here, the yield curve inversion would be a case of a canary dying, but to think that the canary dying caused the subsequent deaths is flawed. The canary died because of carbon monoxide, and this was what killed the miners.
What is the deeper truth to the Yield Curve?
So the question then arises, what is the underlying reason that triggers a yield curve inversion, and can it be caused by other factors that may not trigger a recession? To go back to the canary example, if the canary had an infectious disease that causes all the canaries to die, this is not a reason to exit the mines in panic because there has been no carbon monoxide build up.
Unfortunately, there will be no silver bullet to this answer, because the economy is a living breathing animal, and a myriad of economic factors (eg. employment data, inflation, interest rates, confidence indexes, investment etc) all need to be considered to assess the health of the economy.
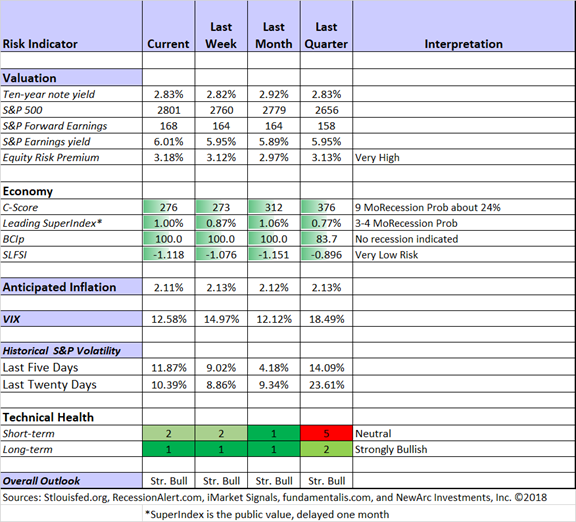
Jeff Miller is one of the bloggers I follow, and he publishes a weekly table summarising the indicators that he follows. I’ve replicated this below, and the current metrics are all looking very low risk.
The Federal Reserve recently came up with a paper making a similar argument, that the yield curve may not be anything more than the market’s expectations about monetary policy (emphasis mine).
In particular, when the near-term forward spread is negative, it signals that investors expect the Federal Reserve to ease monetary policy in the near term. When do investors expect monetary policy easing? Presumably, when they anticipate a substantial slowing or decline in economic activity. Consequently, it is not all that surprising that negative readings for the near-term spread tend to precede (and thus can be used statistically to forecast) recessions. This does not mean that inversions of the near-term spread cause recessions. Rather, the near-term spread merely reflects something that market analysts already track closely–investors’ expectations for monetary policy over the next several quarters and, by extension, the economic conditions driving those expectations. While, measures of the long-term spread also impound this information, they are likely to be affected by other factors unimportant for forecasting recessions, which would likely degrade their forecasting power.
In other words, the canary in the coal mine may be dying because some miners are secretly killing off canaries, thinking that there is carbon monoxide and that this would allow them to escape the mine more quickly.
Which bring me back to my original concern. The yield curve worked for the past 60 years because comparatively few people knew about it. These days, just about every investor out there is looking at the yield curve and waiting for the moment it inverts to sell their stocks. Would that have distortionary effects on the forecast abilities of the yield curve?
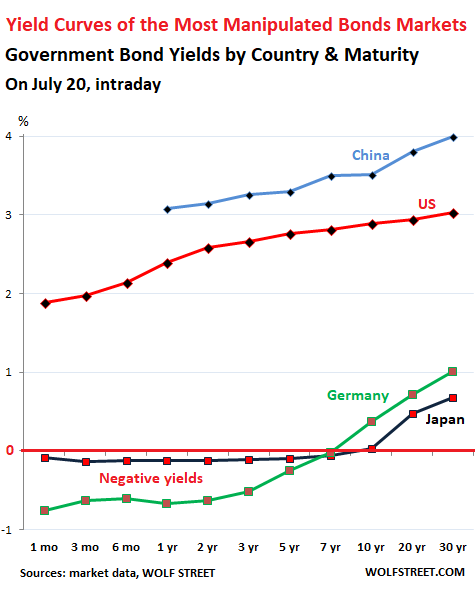
In fact, the Bank of Japan (BOJ) is so aware of the yield curve that “In September 2016, in terms of its QQE bond-buying program, it introduced “Yield Curve Control” – a policy that targets yields along the entire yield curve, and not just short-term yields. This is something no other central bank has tried before. The stated purpose is to keep the 10-year yield near and above 0%.” In other words, the BOJ intentionally controls interest rates such that the yield curve will never invert. I find this quite silly indeed. Using the coal mine example, it’s akin to pumping oxygen to the canaries so they won’t die, and so the miners won’t flee. Sure that works, but if you’re wrong about what causes a recession, you’ve now destroyed the one reliable indicator of a recession that everyone relies on.
You can take a look at how artificial their yield curve looks below, in comparison to the other economies (which granted, are pretty artificial these days too).
So… Yield Curve or not?
Don’t forget that as the Feds pointed out, the past 10 years saw an unprecedented QE program that expanded the Fed balance sheet massively (about US$4 trillion these days). It may be possible that this massive injection of global liquidity has fundamentally altered the DNA of the modern economy, such that a mere inversion of the yield curve fails to indicate poor underlying economic fundamentals, and effectively destroying the predictive capabilities of the yield curve. I suppose the coal mine analogy would be yes, the canaries have died, but due to changes in the working environment, the coal miners now carry oxygen tanks.
At the end of the day, whether you accept the yield curve as truth is going to be a personal decision. Read all the information available, look at all economic indicators, take a look around at the real economy, and decide for yourself whether you want to exit your stock investments.
Personally, I have recently started to notice that if you take away the impending yield curve inversion, the economy in general does seem to be chugging along pretty decently, and most economic indicators are supporting this. Barring an escalation in Trump’s trade wars, the next 12 months could actually be somewhat decent for the global economy.
Of course, I could be wrong, so as always, it is important to invest prudently. Stay away from leverage and don’t invest money you need in the short term. I recently wrote a guide on what you should not do when preparing for an impending recession, so do take a look at that as well.
The Weekly Horse:
All Financial Horse does in his free time during the week is read financial news. With this new initiative (“The Weekly Horse”), hopefully some good can come out of it. During the week, I post articles that I enjoyed on the Facebook Group (do join if you want a sneak peak), and every Sunday I will collate the links for readers. I also take the opportunity to address queries from readers, or share any thoughts that I have for the week. If you enjoyed this post, do share your thoughts in the comments below!
Timely article given the topic I wrote about on Sunday. Have been hearing a lot of murmurings about Singapore as a country falling behind to our global competitors.
Great contrarian take on the yield curve discussion. So many people are talking about an inversion these days, that I’m starting to wonder if perhaps the crowd is wrong yet again. A sell off in 10 year Treasuries is entirely plausible, and would further delay the inversion.
Shared by a fellow reader:
Nobody seems to know/hear/mention about this during the MINT’s AGM yesterday. instead there were many questions on why they pay double the price for the 7 Tai Seng property they bought from their sister company Mapletree Logistic Trust ( MLT). The property was valued at $69 million by independent valuers Cushman & Wakefield and Savills, which was notably higher than the valuation of $36.1 million on MLT’s books. it is explained that the variance in valuation was largely due to a “change in use” for the property given MIT’s plan to convert it from a warehouse building into a high-specification industrial building( speculation likely repositioning of the warehouse into a data centre) But…how on earth does the seller know what the buyer is planning to do with the purchase during negotiation?. shd they not just buy it as it is? Despite their explanation ( they use 2 independent valuers- why not 3? one person asked, parent sponsor Mapletree involved, possible competitive bid from outside. internal processes), I think many left not fully convinced. Great job and negotiation on MLT’s’ part. I guess MINT can do better job next time to anticipate and mange the perception, perhaps with more transparency. For those who hold shares in both counters, sentiment is just going to be mixed…!
Shared by a fellow reader:
Why there is 3 years left in the bull market… and the catch
https://sg.finance.yahoo.com/news/weve-got-3-years-bull-market-theres-catch-103019752.html
Do you have what it takes to become a professional trader? I probably don’t haha, which is why I invest long term.
https://traderfeed.blogspot.com/2018/03/how-fast-is-learning-curve-for-traders.html?m=1
Nice article on the dangerous of excessive leverage. Because sometimes, the journey matters as much as the ending.
https://ofdollarsanddata.com/borrow-if-you-dare/
Financial Horse has a set of 7 Commandments for Successful Investing, that I ask myself before making every investment, and that I will never break regardless of the situation. Enter your email below to receive a copy in your inbox!
[mc4wp_form id=”173″]
Enjoyed this article? Like our Facebook Page for more great articles, or join the Facebook Group to continue the discussion!