As you’ve probably heard by now, the most notable event the past week in financial markets was the “inversion of the yield curve”.
Basics: What is a Yield Curve Inversion?
Very simply, a yield curve inversion happens when the interest rates of short term bonds (eg. 3 months bond, 1 year bonds, 2 year bonds) is higher than the interest rates of long term bonds (eg. 10 year bonds).
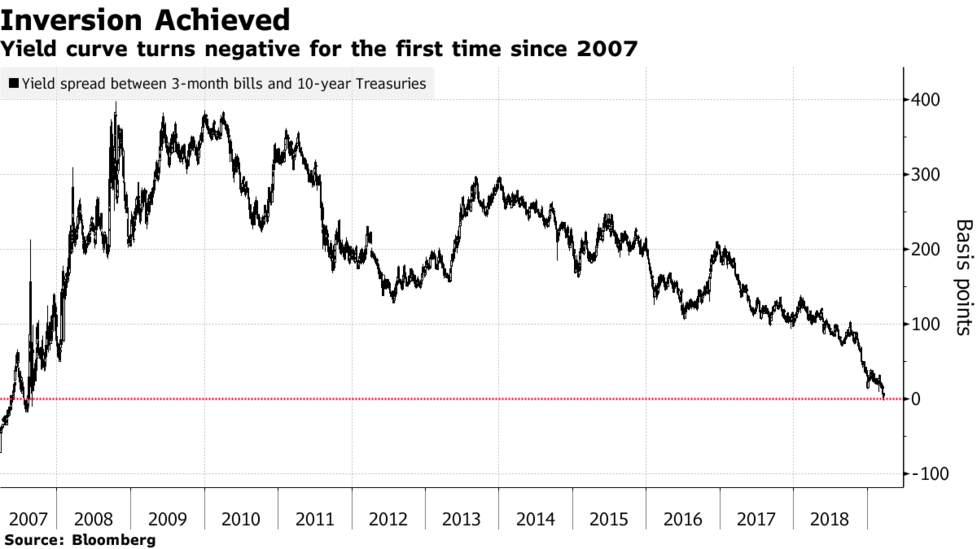
What happened the past week, was that the yield curve for US treasuries (the 3s10s, which is the 3 month treasury yield against the 10 year treasury yield) inverted for the first time since 2007. And we all know what happened following the last yield curve inversion in 2007.
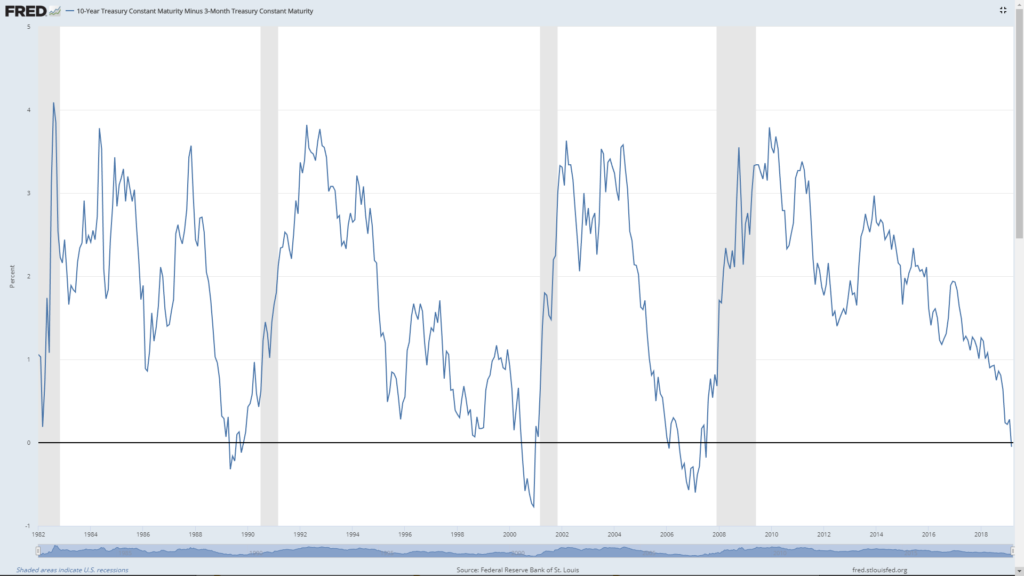
I’ve set out the long term chart of the yield curve (3s10s) below. The last 3 inversions were 1989, 2001, and 2007. The grey area denotes US recessions. As you can see, a yield curve inversion has preceded every US recession in the past 20 years.
Why exactly the yield curve works is anyone’s guess. If I were to venture a guess, I would say it’s a combination of factors.
Discourages lending – The yield curve works because when short term rates are higher than long term rates, it disincentives banks to borrow short term and lend long term (which is how most bank financing is financed). This slowdown in credit slows the economy. A slowing economy eventually translates into trouble for the weaker firms, and as it adds up, eventually results in a recession. This would explain why there is a 1 to 2 year time lag between yield curve inversion and the recession.
Credit markets are usually right – A yield curve inversion is caused by long term rates coming down, and/or short term rates going up. And because market prices reflect the sentiment of average of all investors in the market, this signals that investors are expecting interest rates in the longer term to come down. This is usually due to either slowing economic growth (or slowing inflation) or a Federal Reserve that is cutting interest rates. None of which are good things. And because credit markets are so much bigger (credit market dwarf equity markets) and so much smarter (this is a contentious one, but the credit market is usually a more accurate predictor of economic events than equity markets), this prediction from the credit markets is usually right.
Investor Psychology – The other reason, could simply be psychological. It’s important to never underestimate the effect of investor psychology in markets. A yield curve inversion usually warrants caution from market participants. With too much caution, a recession can become self-fulfilling.
Other Yield Curves
US 2s10s
Since we’re on this topic, I should probably also point out that while the 3s10, has inverted, the 2s10s (2 year vs 10 year) hasn’t, and its still trading at nice 0.16.
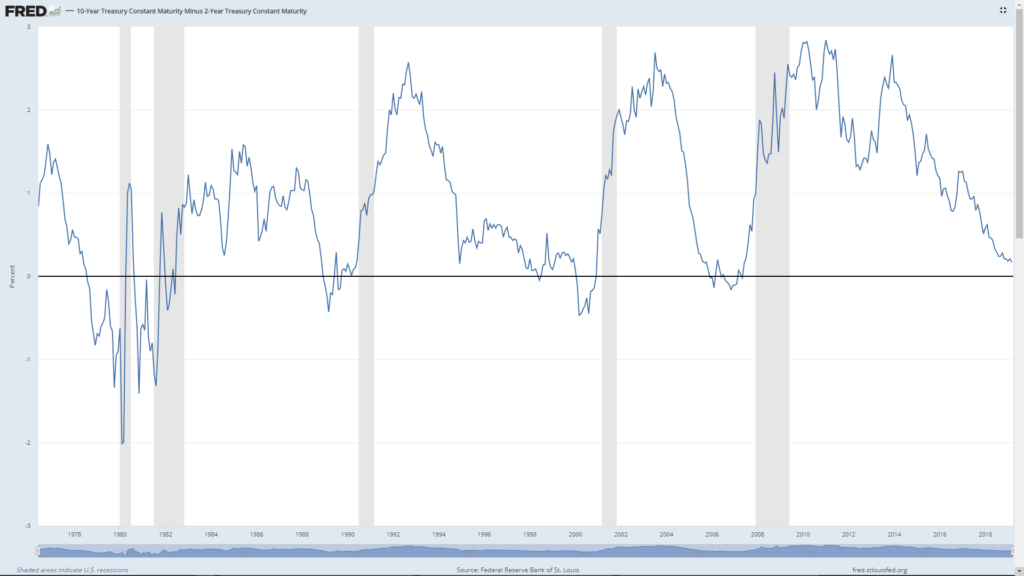
Most “experts” favour using the 3s10s though, so read into that what you will!
Singapore SGS Yield Curve
I was also looking at the Singapore yield curve the past week, and the movement has been really interesting. The 1 year yield has gone from 1.99 to 2.05, and the 10 year has come down from 2.16 earlier this month to 2.04, and back up to 2.07.
The Singapore yield curve is not an accurate predictor of recessions because of the small size of our economy and because we use exchange rate as the primary monetary tool, but it’s still interesting to note.
| TREASURY BILLS | BONDS | |||||||||||||
| 1-YEAR | 2-YEAR | 5-YEAR | 10-YEAR | 15-YEAR | 20-YEAR | 30-YEAR | ||||||||
| ISSUE CODE COUPON RATE MATURITY DATE |
BY19100V
31 JAN 2020 |
NY05100N 3.250% 01 SEP 2020 |
N519100A 2.000% 01 FEB 2024 |
NX18100A 2.625% 01 MAY 2028 |
NZ13100V 3.375% 01 SEP 2033 |
NZ16100X 2.250% 01 AUG 2036 |
NA16100H 2.750% 01 MAR 2046 |
|||||||
| YIELD | PRICE | YIELD | PRICE | YIELD | PRICE | YIELD | PRICE | YIELD | PRICE | YIELD | PRICE | YIELD | ||
| 22 Mar 2019 | 1.99 | 101.89 | 1.92 | 100.35 | 1.92 | 104.78 | 2.05 | 113.19 | 2.30 | 98.42 | 2.36 | 104.69 | 2.51 | |
| 25 Mar 2019 | 1.99 | 101.90 | 1.90 | 100.36 | 1.92 | 104.82 | 2.04 | 113.34 | 2.28 | 98.63 | 2.35 | 104.96 | 2.50 | |
| 26 Mar 2019 | 2.03 | 101.88 | 1.91 | 100.25 | 1.95 | 104.58 | 2.07 | 112.97 | 2.31 | 98.18 | 2.38 | 104.31 | 2.53 | |
| 27 Mar 2019 | 2.04 | 101.89 | 1.90 | 100.40 | 1.91 | 104.72 | 2.05 | 113.11 | 2.30 | 98.37 | 2.36 | 104.58 | 2.51 | |
| 28 Mar 2019 | 2.05 | 101.89 | 1.90 | 100.40 | 1.91 | 104.73 | 2.05 | 113.19 | 2.30 | 98.46 | 2.36 | 104.50 | 2.52 | |
| 29 Mar 2019 | 2.05 | 101.86 | 1.92 | 100.30 | 1.93 | 104.56 | 2.07 | 112.96 | 2.31 | 98.22 | 2.38 | 104.08 | 2.54 | |
Source: https://secure.sgs.gov.sg/fdanet/SgsBenchmarkIssuePrices.aspx
Is this time different?
So now that the yield curve has inverted, will a US recession follow?
If you look purely at the historical data and trends, you’ll probably say that it will, based on sheer precedence. But 20 years of data and 3 recessions doesn’t exactly form an immutable law in global finance.
This economic cycle has been unique in that central banks around the world have flooded the system with excess liquidity. It is possible that this shock to financial system has artificially depressed yields and affected the predictive capabilities of the yield curve. DBS in a recent article sums it up way better than I can:
(2) Effect of Quantitative Easing (QE): Unlike in the past, we do not think inversion, if it happens, is necessarily an accurate indicator of recessions (and by extension, bear markets). Our view is based on the following factors:
Suppressed term premium: Term premium refers to the additional yield needed to compensate investors for undertaking duration risk. As Figure 1 shows, the US 10-year term premium has fallen substantially since the Fed unleashed its QE programme in December 2008. Prior to QE, the term premium averaged 0.96%. But post-QE, it fell to -0.06%, coinciding with the vast expansion of the Fed’s balance sheet. Henceforth, QE has “artificially” weighed on long-term bond yields, causing the yield curve to be flatter than in previous market cycles.
Weak bond yields in other DM: Apart from the Fed’s QE, the weak bond yields in other Developed Markets (DM) is another factor weighing on UST yields. As Figure 3 and 4 show, both the European Central Bank (ECB) and Bank of Japan (BOJ) have similarly embarked on QE. This drove down their respective long-term bond yields. The 10-year Japanese Government Bond (JGB), for instance, is still negative yielding while 10-year USTs are yielding 2.65%. The relative premium drives up demand for the latter, suppressing yields along the way.
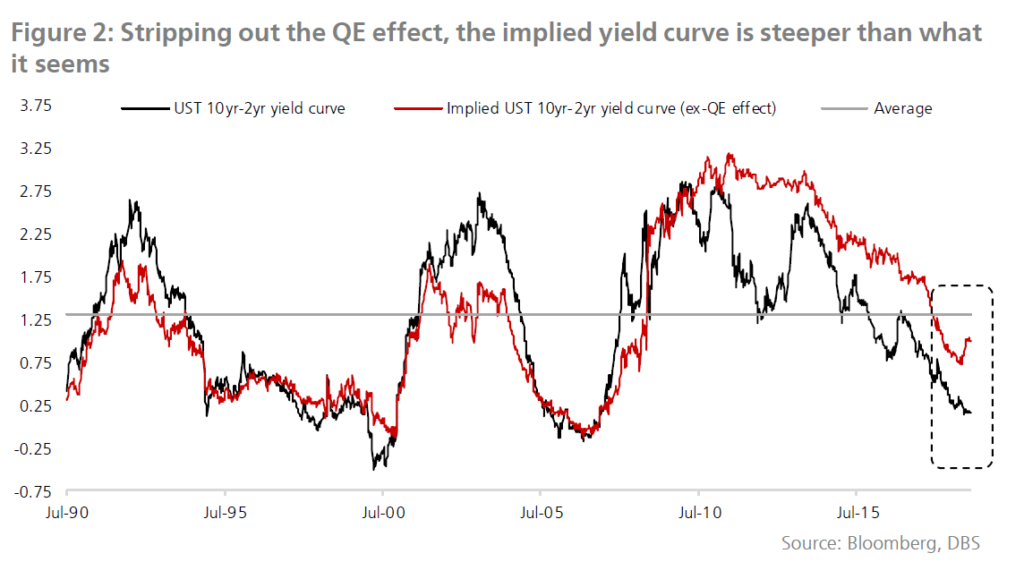
(3) The prevailing flatness of the yield curve has been accentuated by world central banks’ QE policies. Based on our analysis, the yield gap will stand at c.100 bps if one strips out the effect of QE, and this is c.84 bps higher than the current level of 16 bps. This suggests that we are unlikely to see a recession this year. Investors should maintain a constructive stance on risk assets in 2019. In our portfolio allocation, we are Neutral on equities.
These arguments are largely in line with some of the other big names in US who have warned against using the yield curve too closely:
Goldman Sachs Group Inc. added its voice to those advising against panic over the inversion of the U.S. yield curve, which has served as a recession warning in the past.
The proportion of the yield curve that’s inverted isn’t as high as in past recessions, and part of the reason 10-year Treasury yields have slumped can be attributed to dynamics outside the U.S., Goldman strategists led by Alessio Rizzi and Christian Mueller-Glissmann wrote in a note Monday. American credit spreads also aren’t telegraphing stress, they highlighted.
…
“Recession risk remains somewhat low even amid an environment of lower returns” and a high rate of change for volatility itself, the Goldman strategists wrote. While the economic backdrop indeed may be less favorable, hurting profit growth, “equity and risky assets in general can have positive performance with a flat yield curve,” they wrote.
…
Others agree that things aren’t so dire. Fidelity International is among those anticipating a pick-up in growth later this year. Andrea Iannelli, a London-based investment director at the fund manager, wrote Tuesday that “given how much pessimism is already baked into prices, we favor an underweight stance to U.S. rates.”
At Morgan Stanley, strategist Matthew Hornbach thinks the three-month-10-year inversion would need to continue at least until the June Federal Reserve policy meeting before policy makers get “uncomfortable. If it continues beyond that, the Fed may begin to contemplate actions necessary to keep the party going.”
For his part, Chicago Fed President Charles Evans said Monday that yield curves recently have been “throwing off a slightly higher probability of recession” but they have “often misfired” in the past. And Boston Fed President Eric Rosengren said Tuesday he doesn’t “take nearly as much information from the shape of the yield curve as some people do,” though it should pick up if the economy grows as he expects.
Former Fed Chair Janet Yellen said in Hong Kong Monday that inversion happens very easily and doesn’t signal on its own that a U.S. recession is imminent.
But then again, I’m sure there were guys who said the same thing in 2007.
What are my thoughts?
At the risk of looking like a total fool 12 to 18 months from now, I’m actually going to say that I remain sanguine on the outlook of the global economy. I really like how Ray Dalio puts it when he says that following the latest dovish turn from the Federal Reserve (no more 2019 rate hikes), the chances of a US recession have fallen, but what he sees is slow economic growth over the next few years. I do think that’s probably the best prediction of what’s going to happen, based on information currently available.
Previous recessions and yield curve inversions were all caused by an aggressive Fed who tightened into a bubble economy. This cycle, we haven’t really had that kind of bubble market, and while the Fed was aggressive in 2018, they’re done a complete 180 since, way before stresses in the economy started piling up in a material way.
I also think that the effects of QE on the yield curve cannot be understated. The only real parallel to the current QE stimulus would be the 1930s great depression, but the geopolitical climate today is fundamentally different, and we also don’t have accurate data that stretches that far back for a good comparison.
Of course, the other big point is China. I think the EU is done at this point, they’ll probably slide into a mild recession and have to ease further. China though, remains a huge question mark. If economic growth in China slows, it’s bad news for the whole world. If economic growth in China picks up, I think the outlook will be a lot brighter than what people are predicting. And unfortunately, China is a really tough one to call, because of the centrally planned economy. Chinese equity markets these days are trading as if the worst is over, but I’m not convinced.
How am I going to trade?
No one knows for certain how the future will pan out. Everything I said above can hold true today, but if tomorrow Trump decides to pull out of the US-China trade talks and raises tariffs to 25%, then all bets are off.
And that’s only, because investing, much like most things in life, is about risk-reward.
Because I remain sanguine on the global market, I’m not rushing to pull all my money out just yet. My current portfolio is largely split between government bonds (SSBs), CPF, gold, US stocks, REITs, Singapore blue chips, and I’m quite confident it can tide me through whatever there is to come (if you want to look at the exact breakdown, you can subscribe via Patreon).
For the benefit of other readers though, please don’t blindly follow my investment strategy. I invest based on my personal investment objectives, and I do hold large amounts of liquidity to be used in the event that my investments take a turn for the worse. The traditional rules of investing continue to apply: Invest only money that you don’t need in the short term, and stay away from leverage.
What if the Yield Curve is right?
Of course, I could turn out to be absolutely wrong on this, and the global economy slides into a recession in 2020. If so, these are probably the kind of investments I want to have:
Government Bonds – Singapore Savings Bonds. It tracks the Singapore Government Securities yield, is withdrawable at any time with pro-rata interest, and is risk-free. Enough said.
Utilities with a stable monopoly – Don’t pick one of those utilities where the monopoly may come into question in the coming years. The Telco market, and the electricity market come to mind. The only one that I really like in this space is Netlink Trust, but it’s had quite a run-up the last week.
Blue chips with good balance sheet and less vulnerable to disruption – It’s the same thing with blue chips. Don’t just pick a blue chip with a solid balance sheet if the business model is under threat, and may face disruption in the coming years. SIA comes to mind. Pick one where the industry is harder to disrupt. Something like financial services because its highly regulated nature (DBS), or real estate (CapitaLand) comes to mind.
Gold – With interest rates in the US at 2+%, and negative in Europe and Japan, I think its clear that interest rates as a tool in the next recession is going to be highly limited. What is more likely, will be some kind of expanded Quantitative Easing, or some variant of Modern Monetary Theory that is making the rounds (it’s basically just large government spending). All of these will increase money supply and depreciate currencies in a slow economic growth environment. Gold usually performs well in such scenarios.
Closing Thoughts
The yield curve is a really tricky one. Each time it inverts, investors will tell themselves that this time is different, only to be proven wrong in 1 to 2 years. While I genuinely think that this time is different, I’m also not silly enough to be convinced that I am right. So I will continue to monitor the markets going forward, and if it does look like economic growth is going to roll over, I could well change my investment stance.
Till next time, Financial Horse, signing out!
Enjoyed this article? Do consider supporting us and receiving additional exclusive content. Big shoutout to all Patrons for their generous support, and in helping keep this site going!
Like our Facebook Page for more great articles, or join the Facebook Group to continue the discussion!
What’s the risk associated with REITS?
Great question! REITs are a tricky one because they are highly exposed to the real estate market (and interest rates), and at the same time they trade like fixed income instruments. The previous 2008 crisis hit them hard because it was a liquidity crisis, and they had trouble refinancing. My suspicion is that the next “crisis” is going to be a main street one that will affect corporates rather than banks. So this may affect the rental income of REITs, but the exact impact will vary greatly depending on the asset class and geography the REIT is exposed to.
Could you advse how best to invest in gold?
I have an article on gold here that would come in handy: https://financialhorse.com/gold/
A gold ETF like GLD is probably the easiest way. But you if plan on holding it ultra long term (eg. a family heirloom), buying they physical gold may actually work very well.