About a month ago, I wrote an article arguing that Silver may be in a parabolic bubble.
Many readers pushed back, insisting Silver was in price discovery mode and could go much higher.
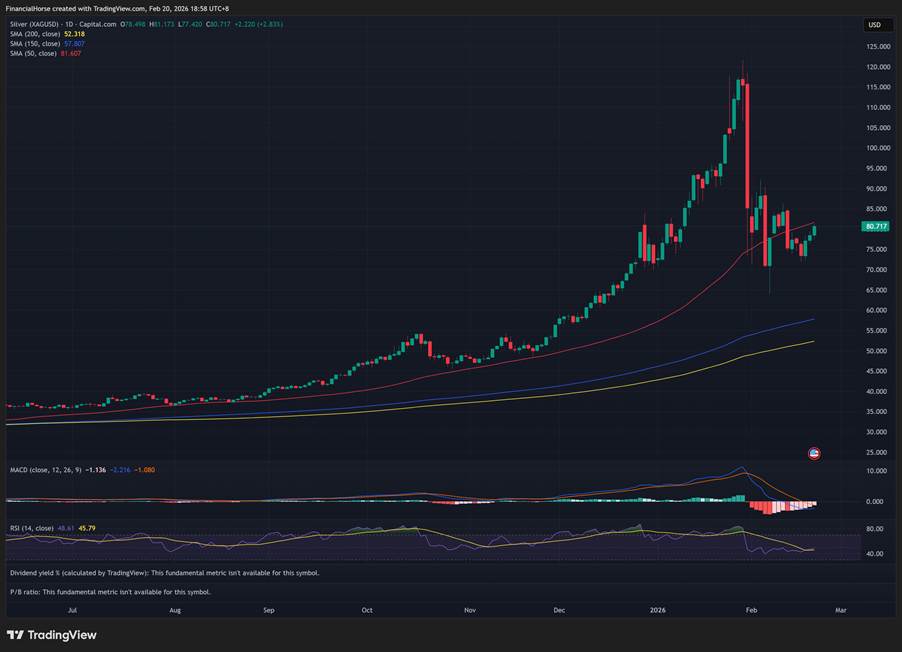
Well since that article, Silver surged as high as $120 before crashing to $64 less than a week later.
It has since recovered to ~$80.
That kind of violent move flushes out speculative leverage – and potentially sets Silver up for its next leg higher.
So for those of you asking me to take a second look at Silver – I agree silver looks interesting, and here goes.
Silver Prices Crashed 50% in 1 Week
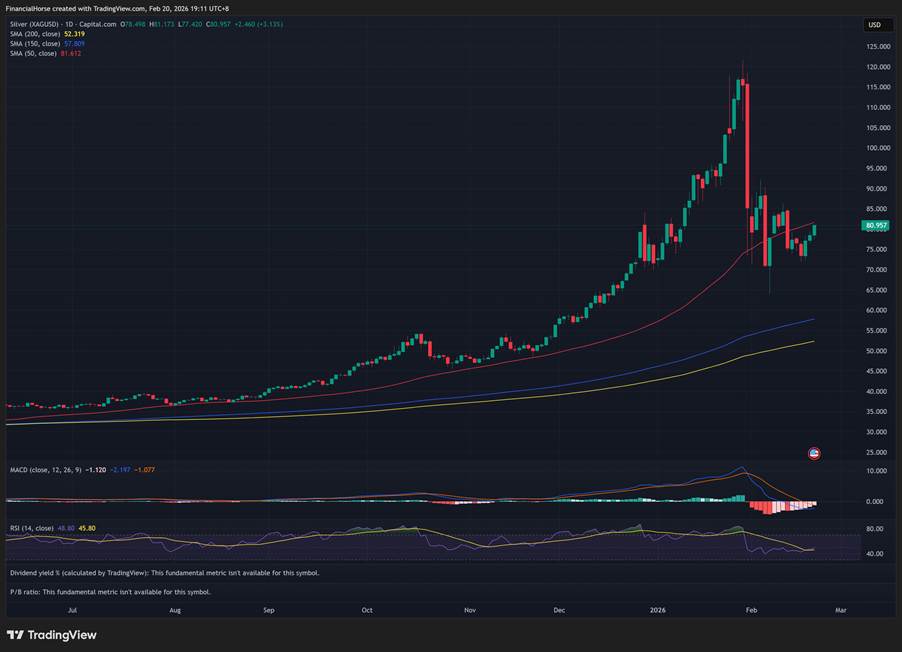
Silver is trading at ~$79/oz today, having pulled back sharply from its all-time high of $121.67 set on January 29, 2026.
Silver is up ~11% YTD but down ~35% from the January peak — a significant correction that may present an entry opportunity.
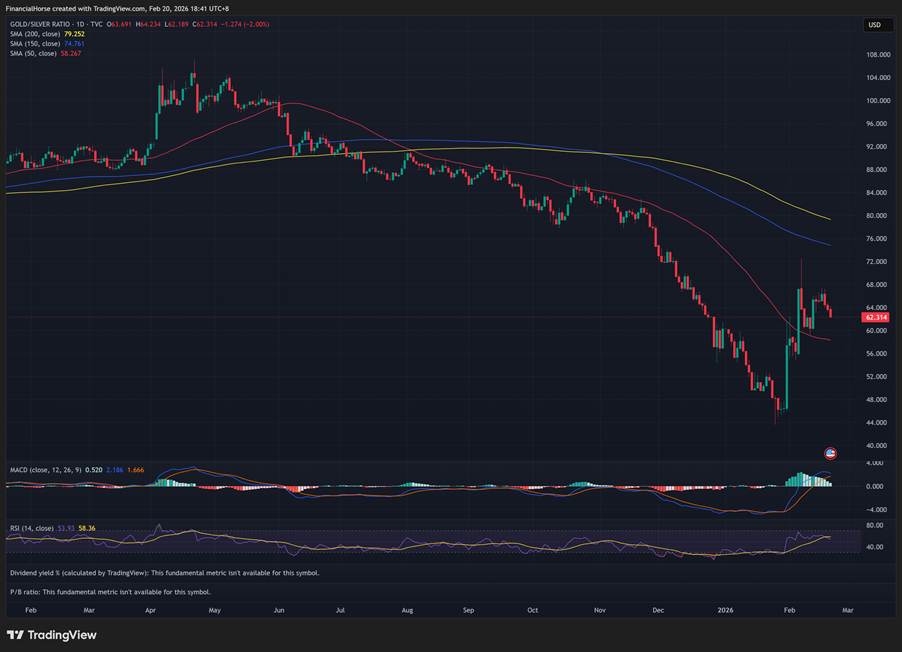
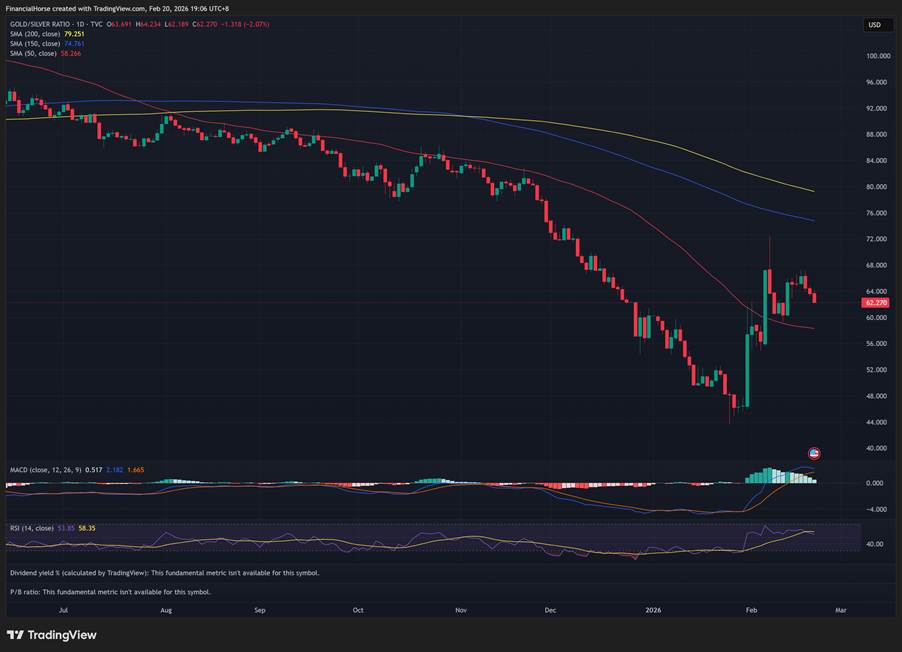
The gold/silver ratio stands at ~63:1, down from above 100 earlier in 2025.
Reasons to be bullish on Silver
In my original article, here was a comment from a reader that set out the bull case for Silver:
“1. Inevitable Fiat and debt debasement
(persistent debt deficit, govs rely on central banks to monetise ever increasing debt)
It’s not about gold and silver going up, but about paper money losing purchasing power. Look at long term yields of major countries or the increasing desperation and actions of certain countries. Look at all assets going up.
2. Geopolitical shifts and dynamics of increasing multi polar world
Resources, energy, commodities are now fundamentally strategic and critical > Countries hoarding metals and rare earths, tariffs, trade restrictions vs silver demand which is now a critical commodity for AI and data centres, EVs, solar, military and wars, beside use in monetary.
3. Suppressed prices and paper market manipulation
Physical demand vs paper supply massively imbalanced due to above (esp silver).
Physical delivery unwinding decades of paper futures market and distortion of price discovery. Suppression cannot persist indefinitely.
*Technicals
Do consider commodity cycles usually being decades long cycles. Note the cup and handle pattern being a 40-year accumulation, case in point. However, as with all markets there will be local tops, corrections and years for this to play out.”
For what it’s worth, I don’t fully agree with this because all of the arguments above are actually reasons to be bullish Gold and Bitcoin.
If I wanted to make a bet on the above, I would say the better play is gold or bitcoin, whereas silver is more of a high beta asset with its own unique supply-demand dynamics.
With that in mind, let’s take a look at the specific supply-demand dynamics of silver.
Supply-Demand Dynamics of Silver
SUPPLY SIDE: Structurally Constrained
Silver production is structurally constrained, and mine output cannot respond easily to price signals.
Why? Because over 70% of silver is produced as a by-product of copper, zinc, lead, and gold mining – meaning higher silver prices alone don’t incentivise new supply. And new mines take 7-10 years from discovery to production.
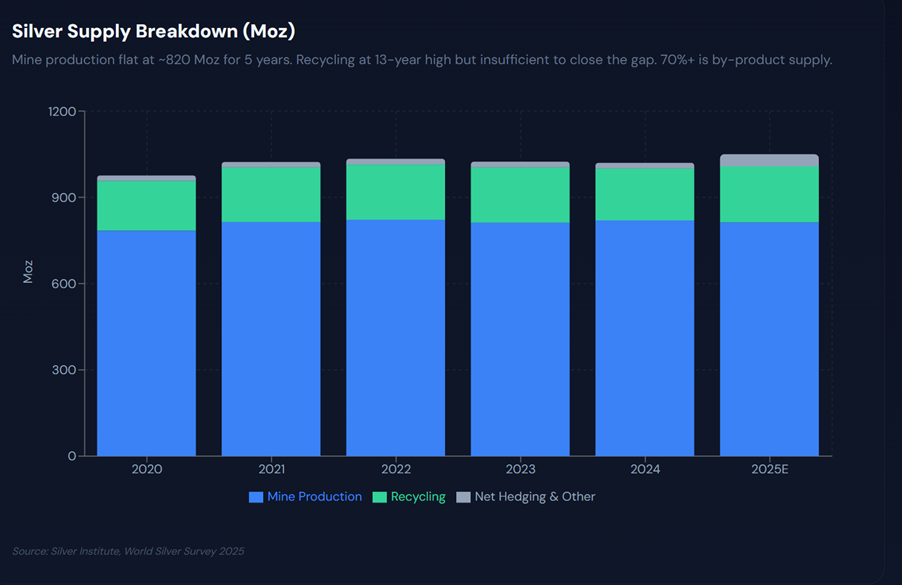
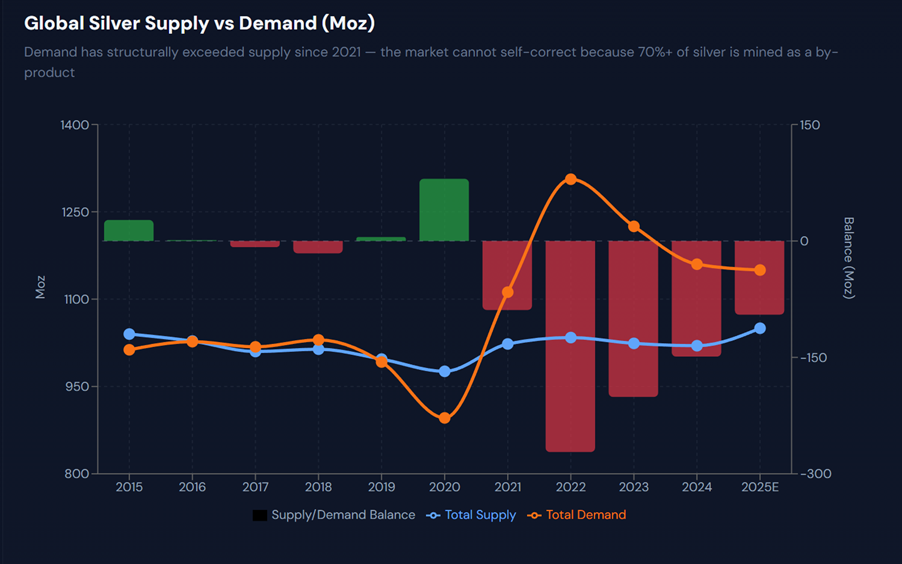
Global mined silver supply is expected at ~813 Moz in 2025, essentially flat year-over-year.
Key supply numbers (2024-2025):
- Mine production: ~820-835 Moz (flat trajectory)
- Recycling: ~195 Moz (13-year high, but still small vs. demand)
- Total supply: ~1.05 Boz (2025 forecast)
A peer-reviewed study in Resources, Conservation and Recycling projects that by 2030, supply may meet only 62–70% of demand, which is a staggering structural gap.
DEMAND SIDE: Structurally Expanding Across Three Mega-Trends
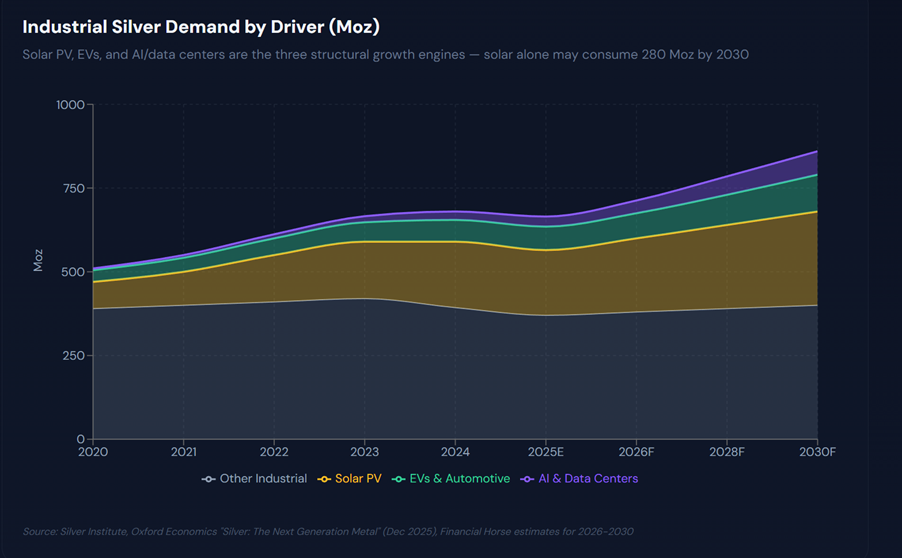
Meanwhile, demand for silver is structurally expanding across 3 mega trends:
1. Solar PV (the dominant growth driver)
In 2014, the solar sector accounted for ~11% of silver demand; by 2024, it rose to 29%. Solar PV capacity is forecast to reach 665 GW in 2026, supporting ~120-125 Moz of silver demand from solar panels alone.
The technology mix is shifting toward TOPCon and SHJ cells, which are more silver-intensive. TOPCon and SHJ cells use respectively 1.5x and 2x more silver per GW compared to PERC cells. While thrifting is occurring (reducing silver per cell), the sheer scale of deployment overwhelms the per-unit savings. By 2030, solar installations may top 500 GW/year, potentially requiring 250 Moz annually.
Counterpoint: Copper plating technologies are emerging that could reduce silver intensity. This is real but early-stage — not a near-term demand destroyer.
2. Electric Vehicles & Automotive
EVs consume 67-79% more silver than ICE vehicles, with approximately 25-50 grams per EV. Global automotive silver demand is forecast to grow at a CAGR of 3.4% between 2025 and 2031. EV production forecast at 14-15 million units in 2026 could add 70-75 Moz of demand.
3. AI & Data Center Infrastructure
Total global IT power capacity increased ~53x, from 0.93 GW in 2000 to nearly 50 GW in 2025. Silver is used in semiconductors, power electronics, connectors, and thermal management. This is harder to quantify precisely but directionally significant and growing.
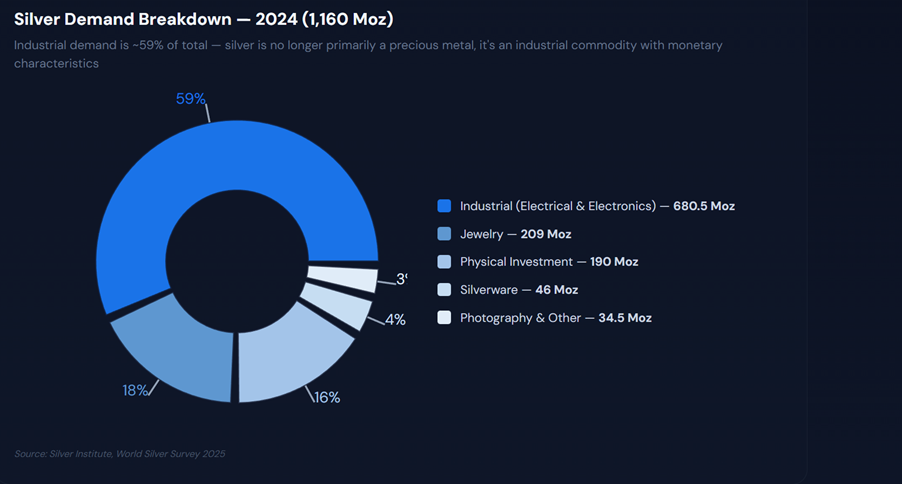
Total demand: ~1.12-1.20 Boz annually (2024-2025), with industrial demand at ~60% of total.
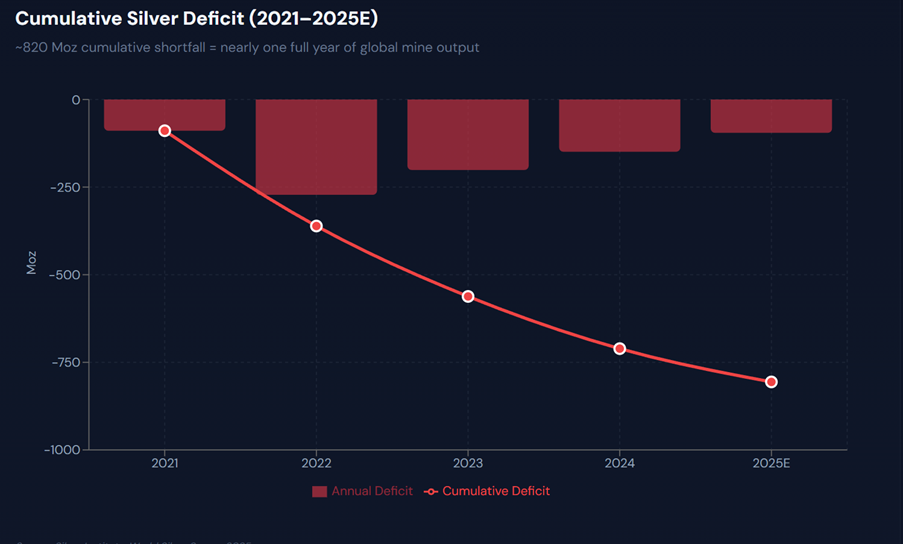
THE DEFICIT: 5th Consecutive Year
Put the above together, and you have a picture of one where demand for silver is structurally higher than supply.
So those of you saying supply-demand dynamics for silver are imbalanced – you are absolutely right.
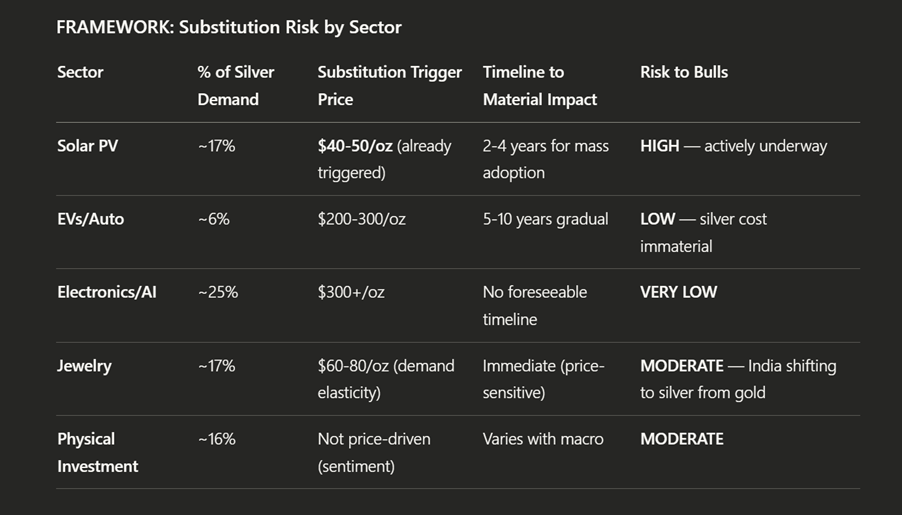
BUT – At What Price Will Industrial Users Switch to Alternatives Like Copper?
The problem with commodities is that higher prices lead to demand destruction.
If silver gets too expensive, producers will switch to alternatives like copper.
The biggest risk is solar PV, where the substitution triggers at 40-50 (already triggered).
The good news though, is that this substitutional doesn’t take place overnight, it takes anywhere from 2 – 4 years.
And even if you assume less demand from solar PV, it doesn’t completely eliminate the structural deficit – it only narrows it.
Risk-Reward of Silver
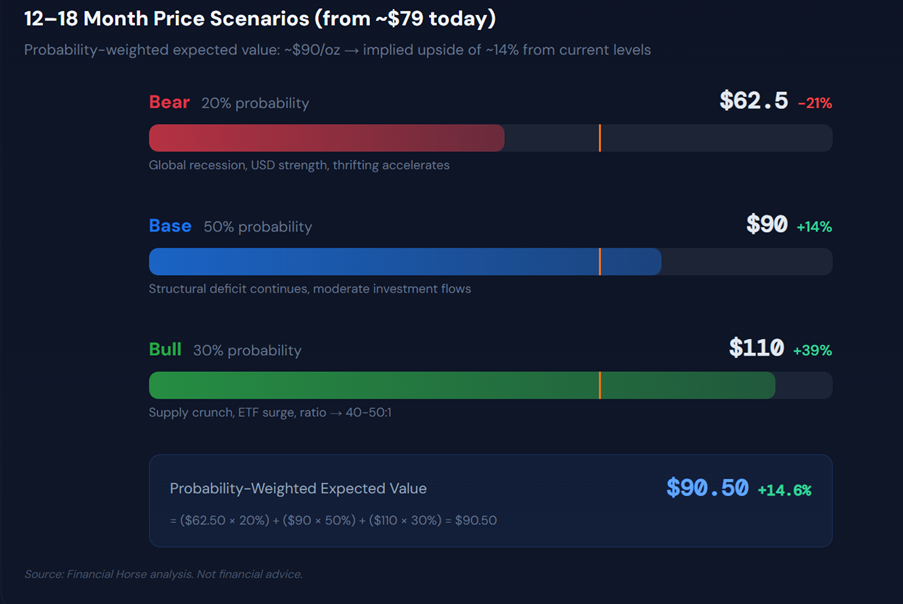
Running the bull/base/bear scenarios for silver gives me the following:
| Scenario | Probability | Price Target (12-18mo) | Key Driver |
| Bull | 30% | $100-120+ | Supply crunch accelerates, ETF inflows surge, gold/silver ratio compresses to 40-50:1 |
| Base | 50% | $80-100 | Structural deficit continues, industrial demand resilient, moderate investment demand |
| Bear | 20% | $55-70 | Global recession crushes industrial demand, tariff escalation, strong USD, thrifting accelerates |
Probability-weighted expected value: ~$87-95/oz over the next 12-18 months.
At today’s ~$79, that implies ~10-20% upside in the base/bull case, with downside risk of ~15-25% in a bear case.
That’s a decent trade, but hardly an asymmetric must-make bet.
Especially when you factor in that silver is a high-beta asset class prone to violent swings.
To compensate for that volatility risk, I would want to see much higher potential returns from silver.
Never miss a post! Follow Financial Horse by subscribing or following us on your favorite platform:
Subscribe to our mailing list for exclusive content straight to your inbox:
Technical analysis for Silver – Is this the bottom?
Technical analysis is somewhat mixed.
My view is that the drop from $121 to $64 in the span of a week was probably the short-term bottom for silver.
That said, there is no clear uptrend yet – prices remain below the 50-day moving average.
If I were to make a trade in silver, ideally I would want to see a new uptrend before I add in size.

At $79, silver has corrected 35% from its ATH.
The gold/silver ratio at ~63:1 is near its long-term average (~55-65), so it’s no longer the screaming relative-value trade it was at 100:1, but it’s not stretched either.
My personal views – Will I buy Silver today?
Gun to my head, I think silver is tactically attractive as a short-to-medium term trade.
But I would see this as a trade rather than an investment.
When silver was going parabolic a month ago, it was clear Silver was in a bubble.
But after the 50% drop, the speculative leverage has been flushed out.
That changes the calculus.
The demand-supply picture is also compelling.
Silver is a by-product of copper and gold mining, so supply cannot ramp up just because prices are higher.
Meanwhile demand is structurally increasing due to the 3 secular demand drivers (solar, EVs, AI).
Yes, higher prices will eventually lead to demand destruction – but that is a 3–5 year story, not a 1 – 2 year one.
That said, 2 things that I don’t like about silver.
First – silver still looks like a falling knife right now.
I would want confirmation of a new uptrend before adding a large position.
Secondly – the risk-reward doesn’t look asymmetric from here.
Base case: if silver recovers to $90–100, that’s about 20% upside.
Bull case: if silver reaches $110–120, that’s 40–50% returns.
Bear case: if silver drops to $60, that’s 25% downside or more.

For a high-beta asset like silver, I would really want to see higher upside potential to justify the risk.
Given the current sell-off in tech and Bitcoin, there are a lot of attractive opportunities out there, and I’m not sure Silver is attractive enough relative to the other opportunities I’m seeing (see the full list of stocks I am keen to add on FH Premium, which I will be updating this weekend).
Love to hear what you think though! Will you buy silver after the 50% crash?
If you enjoy articles like this, do support Financial Horse on FH Premium and get access to premium articles like this, including my stock watch and investment portfolio.
Hi FH,
https://sgwealthbuilder.com/2026/01/31/silver-price-crashed-into-sea/
The silver price squeeze in 2025 was driven largely by fears of US Donald Trump imposing tariffs on the import of silver. That fear has caused some suppliers to withhold silver supplies in their warehouses. The fear is real as unlike gold, silver is extensively used for industrial purposes – EV, solar panels and AI data centers. Any tariffs imposed by US government on silver could cause even more damage to the already strained supply chain system. The resulting squeeze in the supply of physical silver led to a surge in the paper market as silver price rocketed from US$30 per troy ounce in early 2025 to US$70 per troy ounce by end of December 2025.
The threat of tariffs on silver, coupled with US’ capture of Venezuela President, has driven silver price to further record highs in early 2026. However, silver priced tumbled 7.3 percent on 15 January 2026 following US President Donald Trump announcing that he would pause tariffs on silver for now, and would negotiate with foreign countries to ensure sufficient critical minerals for US supply chain instead. Nonetheless, the policy reversal did not really dampen the bullish form of silver price until the crash on 30 January 2026.
Question now is whether the crash is the start of a bubble burst or a healthy pull-back. Based on my macroeconomic assessment, all signs point to the latter. According to the Silver Institute, total supply of silver from mining production has peaked in 2016, resulting in “structural deficit” for the past 5 years – total demand outstripped total supply in the silver market.
https://sgwealthbuilder.com/2026/01/31/silver-price-crashed-into-sea/