Singapore’s Key Household Income Trends 2025 shows real income gains and a drop in inequality to the lowest since 2015.
Singapore households did get richer in 2025.
Inequality also fell, hitting the lowest level since 2015.
The deeper shift is that “income” is no longer just wages: ageing, CPF payouts, and investment income now shape the picture.

This article was written by a Financial Horse Contributor.
Singapore’s “$12,446 median household income”: Is the headline number real?
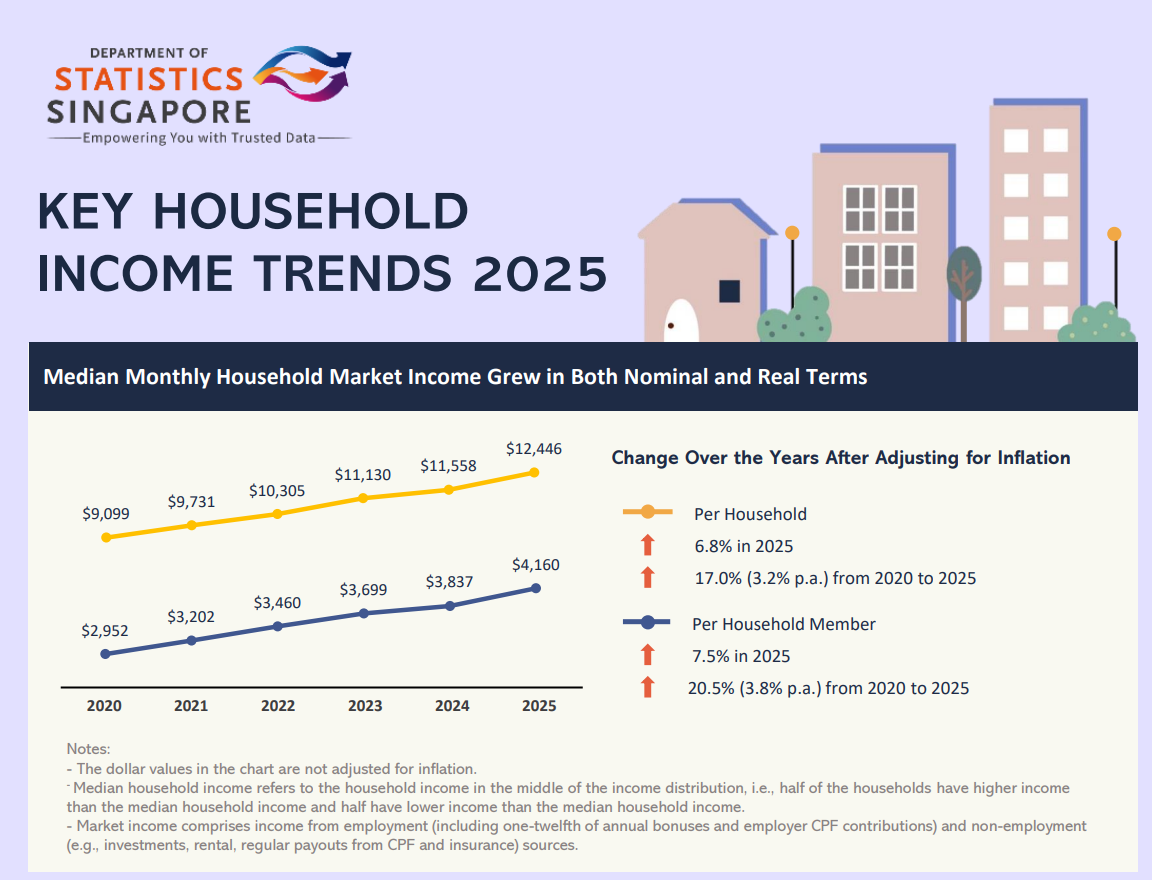
Median monthly household market income rose to S$12,446 in 2025, up from S$11,558 in 2024.
After adjusting for inflation, that’s +6.8% in real terms.
If you account for household size (a better “standard of living” proxy), the median monthly income per household member rose to S$4,160, +7.5% in real terms.
Over five years (2020→2025), the report puts cumulative real growth at +17.0% per household and +20.5% per household member — a meaningful improvement even after inflation.
One reason the numbers are getting so much attention: this is the first time the median has crossed S$12,000 (under this new definition).
Note the definition change
Starting with KHIT 2025, SingStat shifted from tracking mainly employment income to market income — which includes both employment income and non-employment sources such as investments, rent, and regular CPF/insurance payouts.
Even more important: the report now includes resident households with no employed person, not just “resident employed households”.
The logic is straightforward: as the population ages, more households are supported by non-work income streams.
So if you’re trying to compare “today vs 10 years ago”, you need to be careful: part of what’s changed is Singapore — and part is the measuring tape.
Growth is broad-based — and the lower deciles grew faster
A big takeaway that matters for social cohesion: income rose across all deciles in 2025, with higher growth in the lower deciles.
In real terms, the increases ranged from +3.0% to +12.8% across deciles.
A concrete way to see the shape of it is the “average per household member” table by decile (nominal dollars). For example:
- 1st (lowest) decile: S$446 (2024) → S$506 (2025)
- 10th (highest) decile: S$17,232 (2024) → S$17,958 (2025)
A simple “distance” measure (not a full inequality metric, but intuitive) is the top-to-bottom decile ratio:
- 2025 ratio = 17,958 ÷ 506 ≈ 35.5×
- 2024 ratio = 17,232 ÷ 446 ≈ 38.6×
So this rough spread narrowed by about 8%: (38.6 − 35.5) ÷ 38.6 ≈ 8.1%.
In CNA’s coverage, PM Lawrence Wong said wage growth has been “strongest for lower-income workers”.
Never miss a post! Follow Financial Horse by subscribing or following us on your favorite platform:
Subscribe to our mailing list for exclusive content straight to your inbox:
Employment still dominates — but “income” is slowly becoming less about wages alone
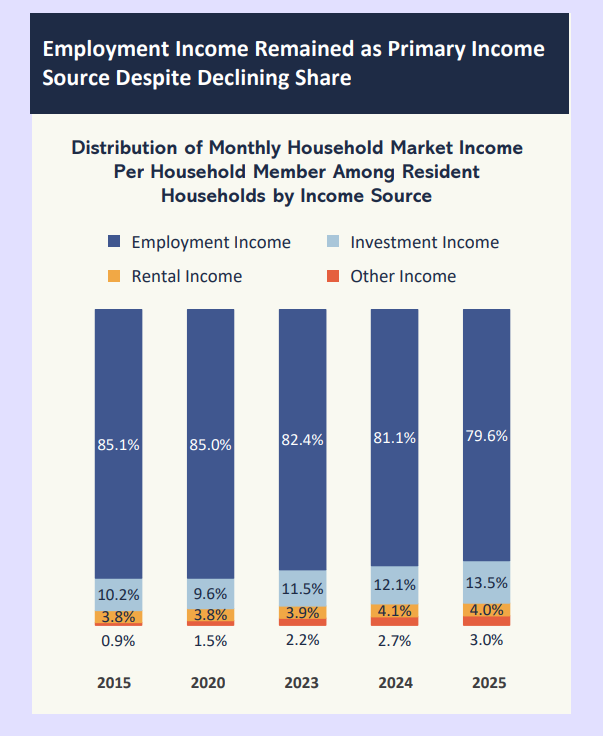
Even after expanding the definition, employment income remains the main pillar — but its share is trending down.
In 2025, employment income formed 79.6% of household market income per member (down from 81.1% in 2024).
The flip side is that non-work income is becoming more important.
The chart in the report shows investment income’s share rising over time, with 2025 showing 13.5% from investment income.
This matters because it changes what “doing well” looks like:
- For working-age households, wages still decide most outcomes.
- For older households, asset income and CPF-related flows matter a lot more — and may explain why some households can “look low-income” on paper but aren’t necessarily cash-poor in the same way.
Some households can still have meaningful assets or CPF balances while having little or no wage income
One of the most revealing lines in the highlights: in the 1st income decile (meaning lowest 10% of households by income), households relied mainly on non-employment sources, especially investment income (40.9%) and other income (37.0%) — largely CPF interest and CPF payout schemes.
And the report explicitly notes composition effects: about 49.3% of households in the lowest decile were households comprising solely non-employed persons aged 65 and over (in 2025).
This is a huge interpretive shift. “Lowest decile” can include:
- seniors living on CPF payouts + savings drawdown,
- households between jobs,
- people with low income but meaningful wealth.
So when people argue online about whether Singapore is getting more unequal, it often turns into two different conversations: one about income, and another about wealth and security.
Refinancing? Check out the best mortgage rates right now
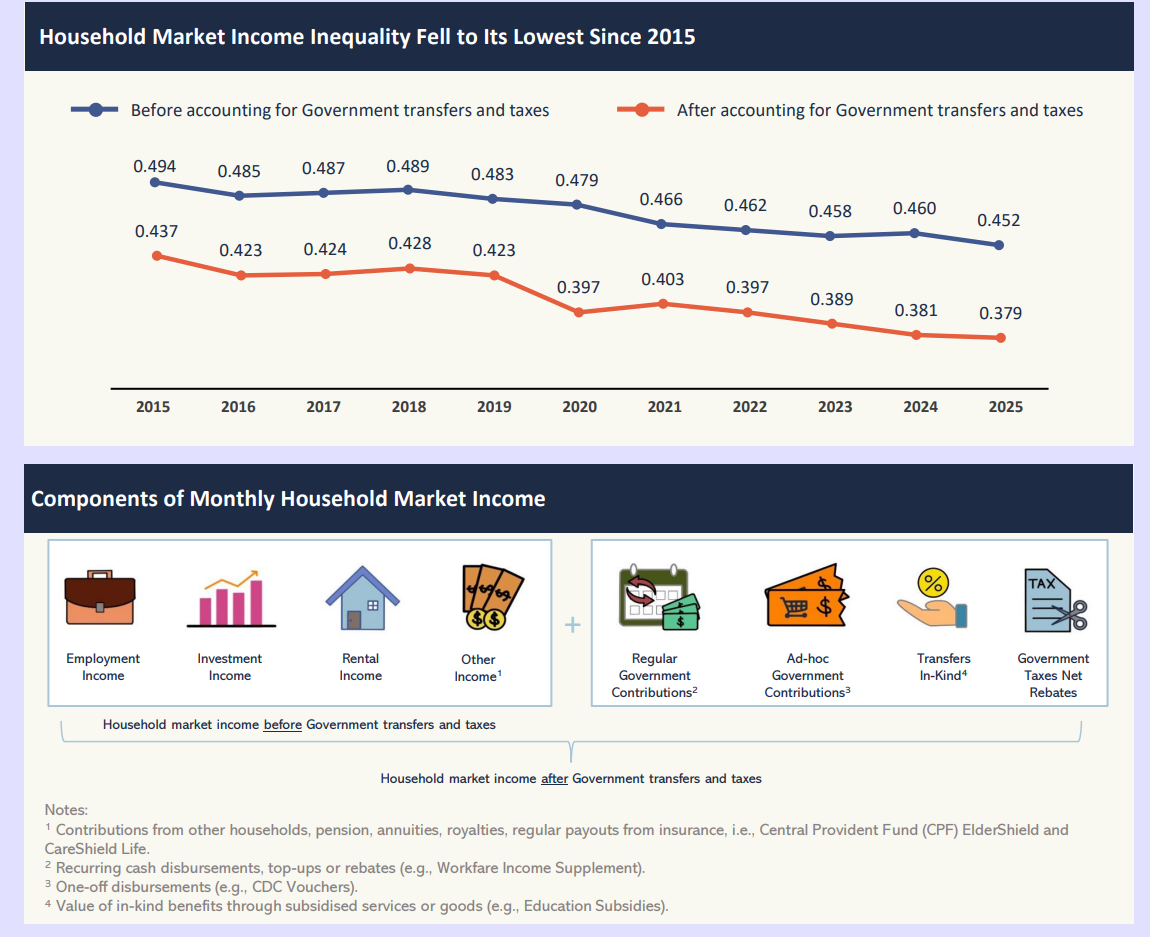
Inequality hit a record low
The report’s inequality headline is striking: the Gini coefficient (market income per member) fell from 0.460 (2024) to 0.452 (2025) — the lowest since the market-income series began in 2015.
After government transfers and taxes, it fell further to 0.379, also the lowest since 2015.
The mechanism is visible in the transfer figures: in 2025, resident households received S$7,300 per household member in government transfers on average (regular + ad-hoc + in-kind).
Households in HDB 1- & 2-room flats received S$16,519 per household member on average — more than double the overall average.
CNA quoted PM Wong describing the “returns” to households per tax dollar paid: lower-income households receive “about S$7” in benefits per dollar of tax paid, middle-income about S$2, and the top 20% about S$0.20.
That’s a useful way to understand Singapore’s model: keep incentives for growth, but push resources (especially in-kind support) down the income distribution.
Why some households still don’t feel richer, even when the median rises
A rising median can still coexist with “I don’t feel better off” — for a few reasons:
Median ≠ your experience. Household types vary wildly: single earners, dual-income couples, retirees, multi-generation households. The same national median can mask very different realities.
Big-ticket costs are lumpy. Housing moves, childcare phases, eldercare needs — these don’t rise smoothly with inflation, and they don’t hit every household at the same time.
Data gaps at the top (and sometimes bottom). SingStat and MOF both note measurement limits: some non-employment income is harder to track and may be underreported, especially for wealthier households with overseas assets.
So the correct read is not “everyone is richer now” — it’s “real incomes improved overall, but the distribution of pressure points is uneven.”
The forward-looking question for Singapore: will the next decade be wage-led or asset-led?
KHIT 2025 quietly signals a structural shift: Singapore is becoming a place where household resources are increasingly shaped by assets, not just wages.
MOF’s accompanying paper frames the longer arc: broad-based real income growth, lower inequality after taxes/transfers, but also a note that social mobility may be moderating as the economy matures.
That leaves three big things to watch in the next few years:
- Wage momentum (especially for the middle) versus inflation and job restructuring.
- Asset-income dispersion (who benefits when markets and property do well).
- Transfer design as one-off support fades and needs become more age-related (healthcare, retirement adequacy).
KHIT 2025 is positive on real income and inequality — but the deeper insight is that “household income” in Singapore is no longer mainly a pay cheque story.
It’s becoming a combined story of wages, CPF flows, assets, and policy.