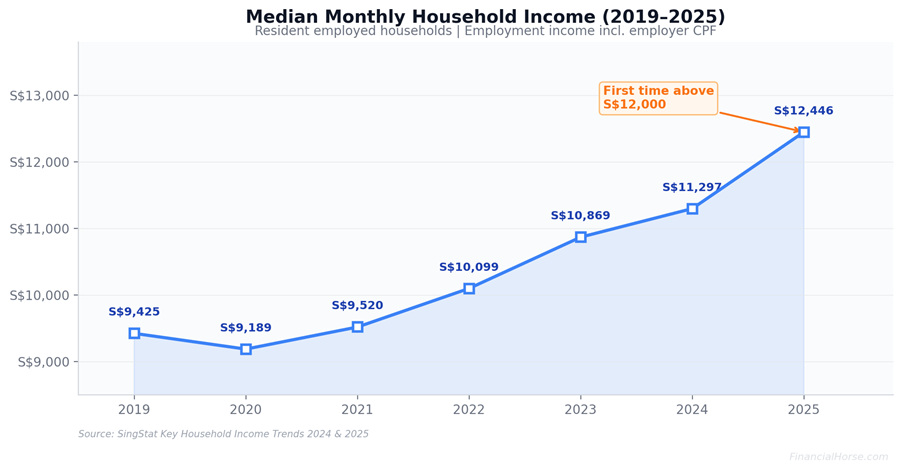
The median household monthly income hit $12,446 in 2025.
That’s the first time ever the median monthly household income has crossed $12,000.
But whether that’s “good” depends entirely on your life stage, household structure, and where you sit on the income distribution.
And what does that even mean practically?
In this article, I wanted to break down the full income data for Singapore — by individual, household, age, industry, and occupation — so you can benchmark where you stand and what “good” actually means in practical terms.
Data generally sourced from the Ministry of Manpower (MOM) Labour Force Survey 2024, SingStat Key Household Income Trends 2024 and 2025, and IRAS tax schedules. Figures include employer CPF contributions unless otherwise stated.
The Headline Numbers: Individual Income (2024)
Let’s start with the basics.
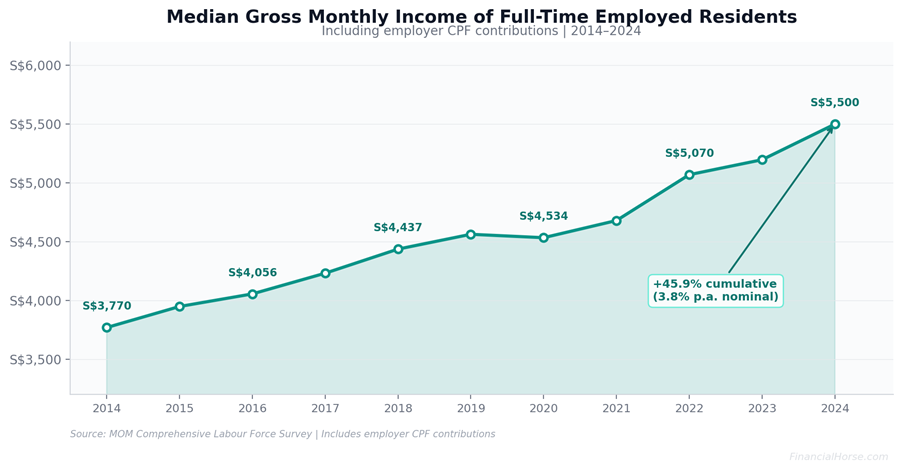
Individual (full-time employed residents):
| Metric | Monthly | Annual |
| Median gross income (incl. employer CPF) | S$5,500 | S$66,000 |
| Mean gross income (incl. employer CPF) | ~S$6,138 | ~S$73,656 |
| Median gross income (excl. employer CPF) | S$4,860 | S$58,320 |
The median rose 5.8% in nominal terms from S$5,197 in 2023. Over the past decade (2014–2024), the median has grown at 3.8% per year nominally, or 2.2% per year in real (inflation-adjusted) terms.
The mean being significantly higher than the median tells you what you already know — the income distribution is right-skewed, with high earners pulling up the average.
Quick interpretation: If you’re an individual earning S$66,000/year (inclusive of employer CPF), you’re right at the midpoint. Half of all full-time working residents earn more than you, and half earn less.
Singapore Household Income (2024–2025)
Most Singaporeans live in multi-income households, so household income is arguably the more relevant benchmark for living standards.
Resident employed households (2024):
| Metric | Monthly |
| Median household employment income | S$11,297 |
| Average household size | 3.09 persons |
| Median income per household member | S$3,615 |
Updated 2025 data (released February 2026):
The latest SingStat data shows median monthly household market income crossed S$12,446 in 2025 — a 7.7% nominal increase — the first time it has exceeded S$12,000.
The median household income per member rose to S$4,160 in 2025, up from S$3,837 in 2024. This figure now includes non-employment income (rental, investment, CPF payouts) for the first time.
Where Do You Sit? Income by Decile
This is where the data gets interesting.
SingStat ranks all resident employed households by income per household member and divides them into 10 equal groups (deciles).
Average monthly market income per household member (2025):
| Decile | Monthly per member |
| 1st (Bottom 10%) | S$506 |
| 5th | S$3,745 |
| 10th (Top 10%) | S$17,958 |
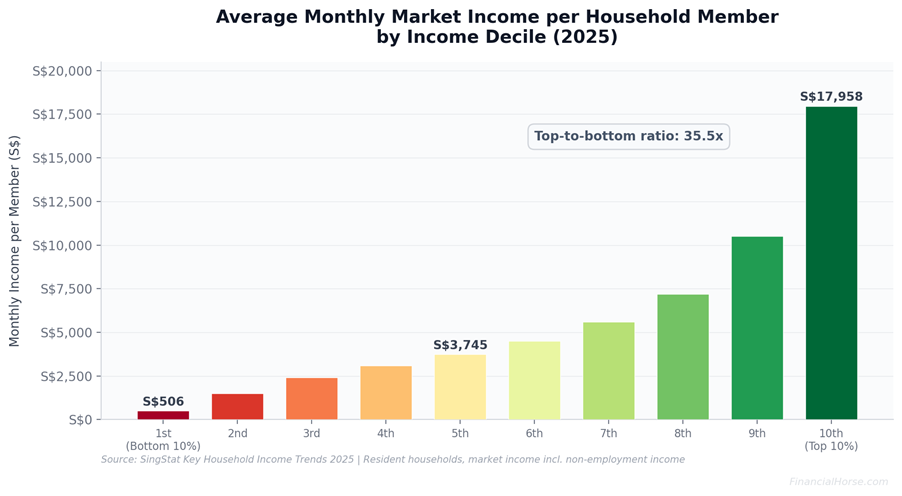
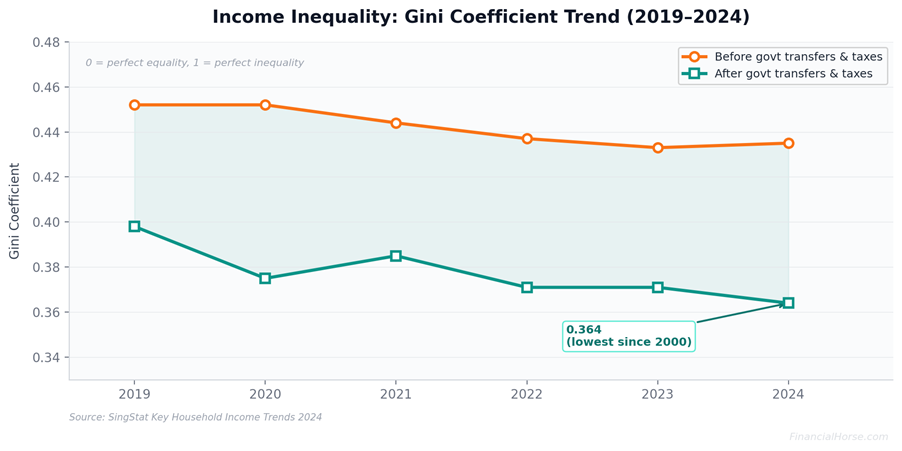
Between 2019 and 2024, the average income per member for the first nine deciles grew by 0.3% to 1.9% annually in real terms. The top decile actually declined by 0.7% per year — a narrowing of inequality at the upper end.
Inequality has gone down?
The Gini coefficient (a measure of inequality, where 0 = perfect equality and 1 = perfect inequality) was 0.435 in 2024 before government transfers, falling to 0.364 after transfers and taxes — the lowest since records began in 2000.
In the 2025 data, the market income Gini fell further to 0.452 (from 0.46), with the post-transfer figure at 0.379.
This means that actually inequality (as measured by the Gini coefficient) is going down.
Although some of you may say it does not feel that way when you look around, but this is that the numbers say.
Income by Age: When Does Your Pay Peak?
Singapore’s income distribution follows a classic bell curve by age. Here is the median gross monthly income (including employer CPF) for full-time employed residents, by age group (2024):
| Age Group | Median Monthly Income |
| 20–24 | S$3,269 |
| 25–29 | S$4,680 |
| 30–34 | S$5,870 |
| 35–39 | S$7,049 |
| 40–44 | S$7,434 |
| 45–49 | S$7,498 |
| 50–54 | S$6,400 |
| 55–59 | S$5,000 (approx.) |
| 60+ | Declines significantly |
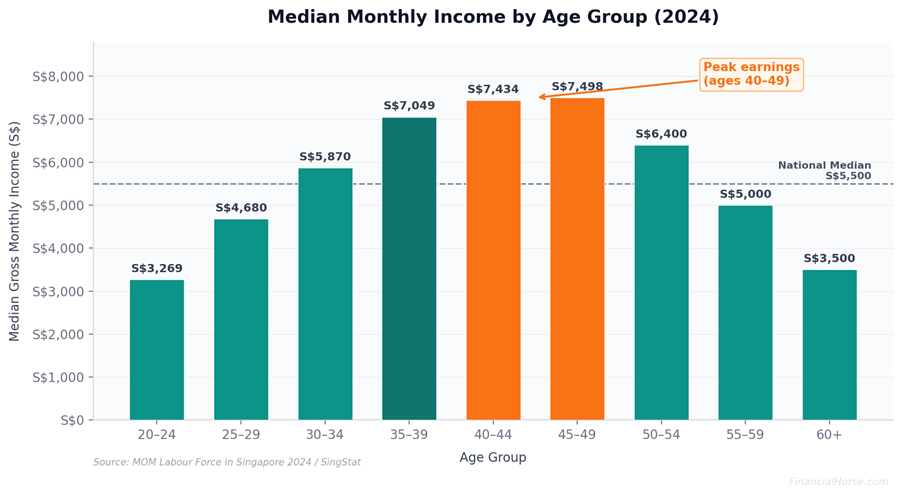
Key takeaways:
Peak earnings occur between ages 40 and 49, with the sweet spot at 45–49. After 50, incomes decline as workers shift roles, reduce hours, or face age-related challenges in the job market.
The biggest percentage jump happens between 20–24 and 25–29 (a 43% increase), reflecting the transition from entry-level roles to mid-career.
If you’re 35 and earning above S$7,000/month (S$84,000/year including employer CPF), you’re at or above the median for your age group.
If you’re 45 and earning above S$7,500/month (S$90,000/year), the same applies.
Income by Industry (2024)
Industry choice is one of the biggest determinants of income in Singapore. The spread between top and bottom is nearly 3x.
Median gross monthly income by industry (full-time employed residents, 2024):
| Industry | Median Monthly |
| Financial & Insurance Services | S$8,736 |
| Information & Communications | S$7,605 |
| Public Administration & Education | S$7,032 |
| Professional Services | S$6,900 |
| Manufacturing | S$5,860 |
| Wholesale & Retail Trade | S$5,070 |
| Construction | S$4,914 |
| Real Estate Services | S$4,908 |
| Health & Social Services | S$5,100 |
| Administrative & Support Services | S$3,296 |
| Accommodation & Food Services | S$2,974 |
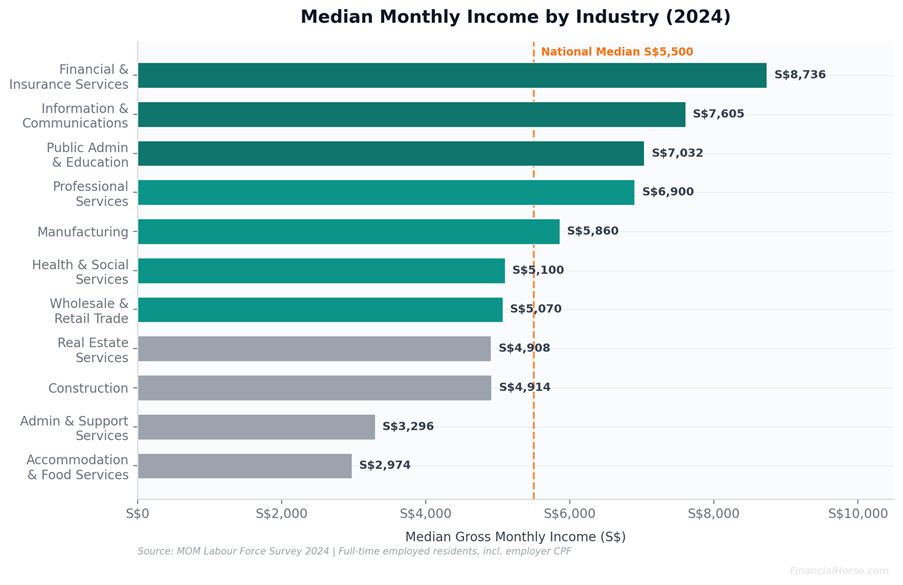
Financial services has consistently been Singapore’s highest-paying sector, and saw a further 6.7% growth in 2024. Tech (Info-Communications) rose about 3.9%.
If you work in finance or tech and earn below S$8,000–9,000/month, you’re below your industry’s median — even if you’re above the national one.
Income by Occupation (2024)
Beyond industry, your occupation tier matters enormously.
| Occupation Group | Median Monthly (2024) |
| Managers & Administrators | ~S$10,500+ |
| Professionals | ~S$7,500+ |
| Associate Professionals & Technicians | ~S$5,000+ |
| Clerical Support Workers | ~S$3,300 |
| Service & Sales Workers | ~S$2,700 |
| Cleaners, Labourers & Related Workers | ~S$2,070 |
Managers and administrators who are aged 45–49 can expect median incomes of around S$11,000/month.
For PMETs (Professionals, Managers, Executives, and Technicians) as a whole — who now make up about 65% of the employed resident workforce — incomes run substantially above the national median.
What Does a “Good” Salary / Income Actually Look Like?
Here’s the real question — and the answer depends on your life circumstances.
Scenario 1: Single, no dependents, living with parents
This is the lowest-cost scenario. With minimal housing costs, a gross monthly income of S$4,000–5,000 (S$48,000–60,000/year) can provide a comfortable lifestyle with room for saving and investing.
“Good” here: S$5,500+ (above median), or S$7,000+ if you want aggressive savings rates.
Scenario 2: Single, renting your own place
Renting a room in an HDB flat costs S$800–1,200/month. Renting a full unit is S$2,000–3,500 depending on location. Add in food (S$500–800), transport (S$100–150), and utilities, and you’re looking at S$3,500–5,500/month just for basics.
“Good” here: S$7,000–8,000/month gross (S$84,000–96,000/year) to live comfortably and still save.
Scenario 3: Married couple, dual income, no kids, owning an HDB
A typical HDB mortgage runs S$1,500–2,500/month (partially serviceable through CPF). With dual incomes, a combined household income of S$10,000–12,000/month (roughly the national household median) covers essentials and allows for moderate savings.
“Good” here: S$12,000+ combined household income (each partner earning ~S$6,000+).
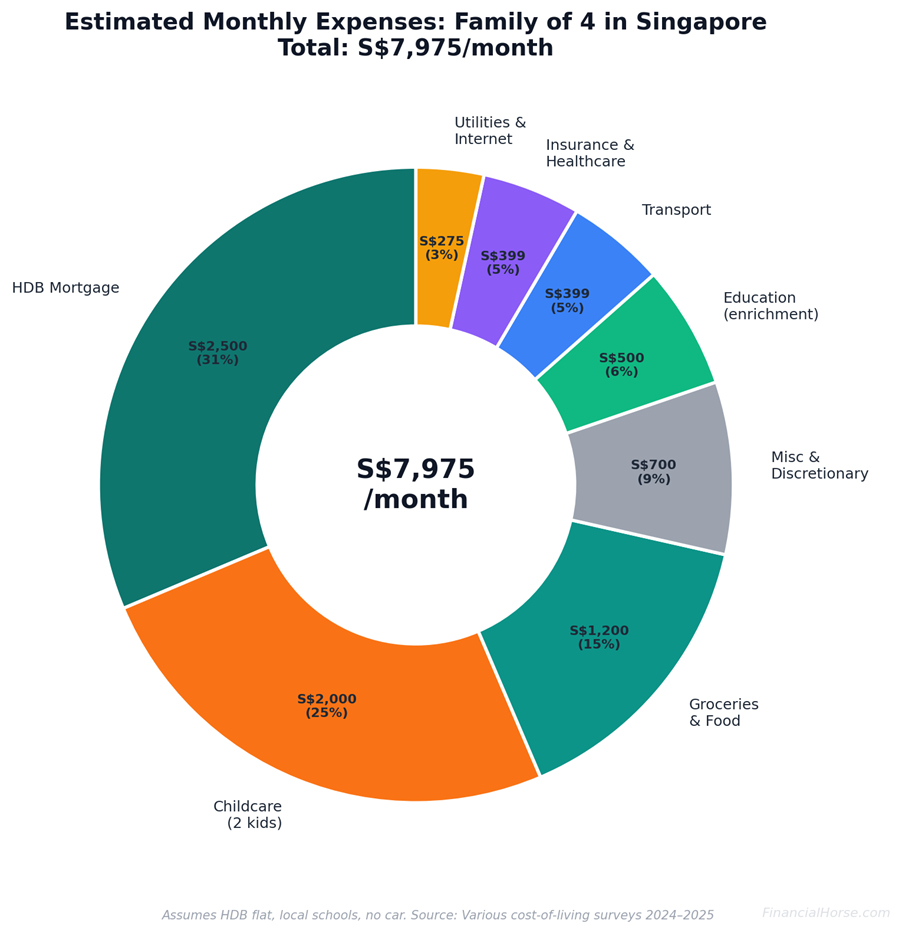
Scenario 4: Family of 4, with mortgage and childcare
This is where costs compound. Estimated monthly outlay:
| Expense | Monthly Range |
| HDB mortgage / Condo mortgage | S$2,000–4,500 |
| Childcare (per child) | S$800–2,000 |
| Groceries & food | S$1,000–1,500 |
| Transport | S$300–500 |
| Utilities & Internet | S$200–350 |
| Insurance & Healthcare | S$300–500 |
| Education (enrichment, etc.) | S$300–800 |
| Total | S$5,000–10,000+ |
For a family of four with two young children, a household income of S$12,000–15,000/month (S$144,000–180,000/year) is what you need for a comfortable — not lavish — lifestyle. That assumes HDB living, local schools, and no car ownership.
A car adds S$1,500–2,500/month (loan, insurance, petrol, parking, COE depreciation). Condo living adds another S$1,000–2,000 above HDB costs. International schools are S$2,000–4,000/month per child.
“Good” here: S$15,000+ household monthly income (S$180,000+/year) for genuine financial comfort with room to invest.
The Tax Advantage: Why Singapore Incomes Go Further
One reason Singapore’s nominal income numbers look different from cities like London, New York, or Sydney is the tax regime.
Singapore’s progressive income tax rates, compared to UK and US:
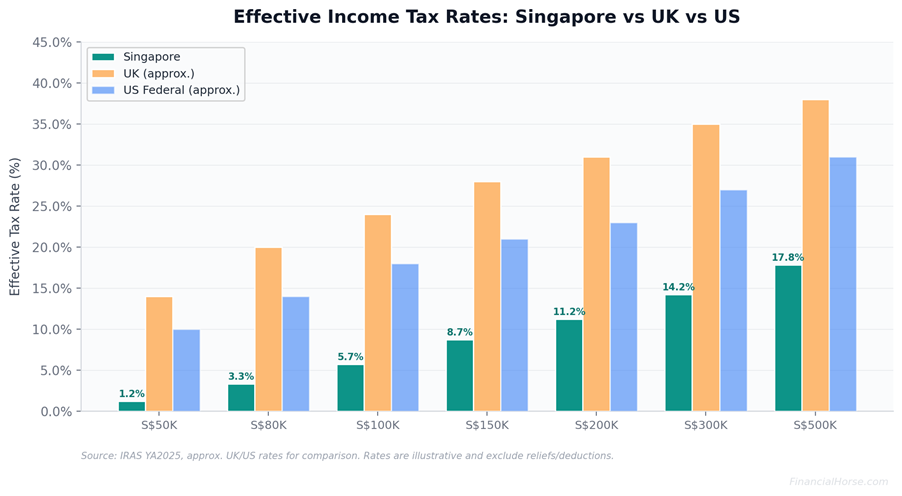
What this means in practice:
Someone earning S$100,000/year in chargeable income pays approximately S$5,650 in income tax — an effective rate of about 5.7%.
Compare that to the UK (where the same income attracts ~20%+ effective tax) or the US (~22%+ federal effective rate).
Add CPF contributions (employee: 20% of ordinary wages up to S$6,800/month; employer: 17%), and you have a mandatory savings-plus-tax burden that is still substantially lower than most developed countries.
CPF, unlike tax, accrues to your own accounts (Ordinary, Special, MediSave) and can be used for housing, retirement, and healthcare.
There is no capital gains tax and no inheritance tax — a structural advantage for wealth accumulation.
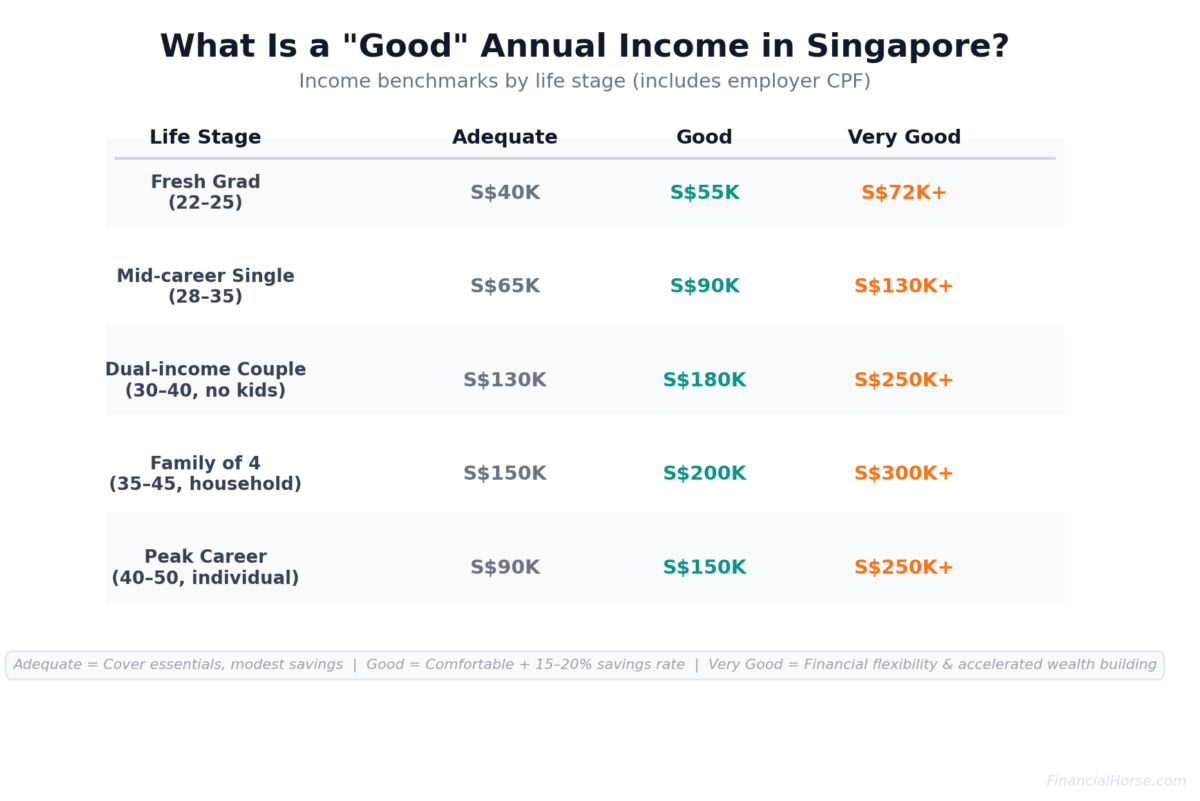
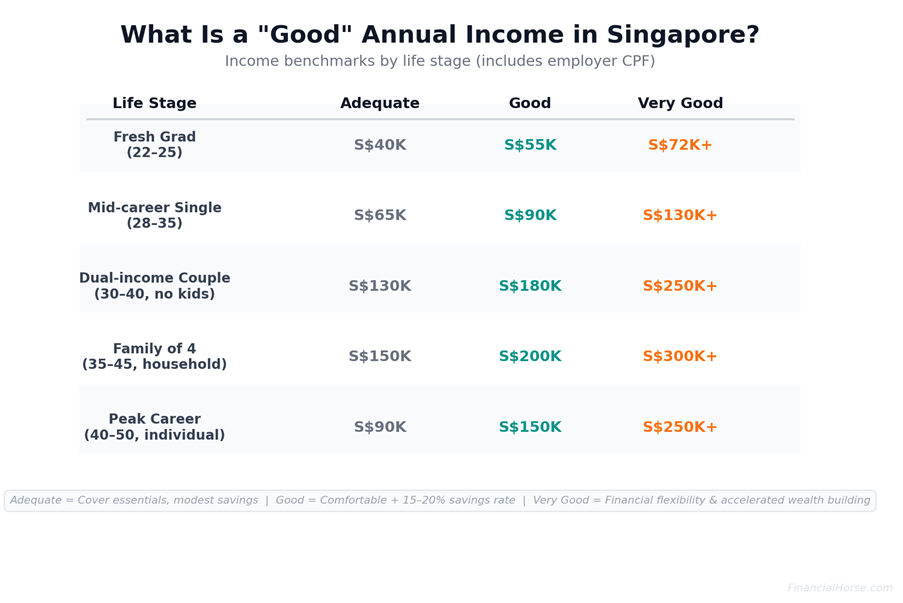
Putting It All Together – What is a “Good” Annual Income in Singapore?
Based on all the data above, here is a practical framework for what constitutes a “good” annual income in Singapore at various life stages (I could be wrong though – welcome any comments):
| Life Stage | “Adequate” Annual | “Good” Annual | “Very Good” Annual |
| Fresh grad (22–25) | S$40,000 | S$55,000 | S$72,000+ |
| Mid-career single (28–35) | S$65,000 | S$90,000 | S$130,000+ |
| Dual-income couple (30–40, no kids) | S$130,000 (combined) | S$180,000 | S$250,000+ |
| Family of 4 (35–45) | S$150,000 (household) | S$200,000 | S$300,000+ |
| Peak career (40–50) | S$90,000 (individual) | S$150,000 | S$250,000+ |
All figures include employer CPF contributions. “Adequate” means covering essentials with modest savings. “Good” means comfortable living with a meaningful savings/investment rate (15–20%). “Very good” means financial flexibility, accelerated wealth building, and ability to absorb lifestyle upgrades or shocks.
The Real Answer: It Depends on Your Goals
That said, at the end of the day, a “good” income is subjective.
I would say an income that lets you:
- Cover your essential expenses with a buffer
- Save and invest a percentage of your gross income consistently
- Make progress toward financial goals — whether that’s paying off your HDB, building a retirement portfolio, or reaching financial independence
Is a good income.
The national median of S$66,000/year (individual) or S$149,000/year (household) is a starting benchmark.
But if you’re in finance, tech, or a professional services role in Singapore, the relevant benchmark is your industry and age-group median — not the national number.
And remember: income is only half the equation. What you do with that income — your savings rate, investment returns, and lifestyle cost control — ultimately determines your financial outcome.
A person earning S$120,000/year who saves 30% will build wealth faster than someone earning S$200,000 who spends it all.
Never miss a post! Follow Financial Horse by subscribing or following us on your favorite platform:
Subscribe to our mailing list for exclusive content straight to your inbox:
Dear FH,
As usual. Nice article. Just 1 pointer for your consideration. You mentioned ” A car adds S$1,500–2,500/month (loan, insurance, petrol, parking, COE depreciation).” ==> I am of the opinion that this figure is likely to be $2,000 – $4,000/mth. Just take a look at the COE depreciation component. Current COE is about $100K, this piece of paper will contribute $833/mth.
Cheers
Hi aaa,
You are absolutely right, my bad. After running the numbers myself, I agree a 2-4k number is a better estimate. 1.5 – 2.5k is on the low side and doesn’t factor in the current higher costs.