So UBS released its Global Wealth Report 2026 on 30 June 2026.
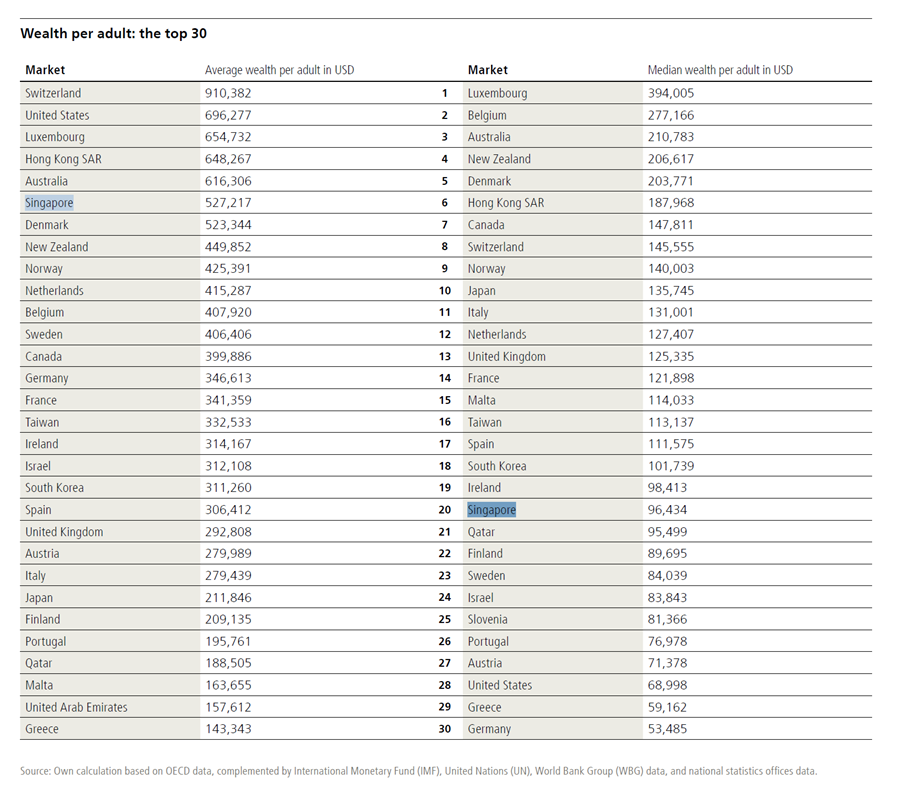
And the headline that’s been everywhere: the average Singaporean adult is worth US$527,217 — roughly S$682,000.
But the number nobody is talking about is the median.
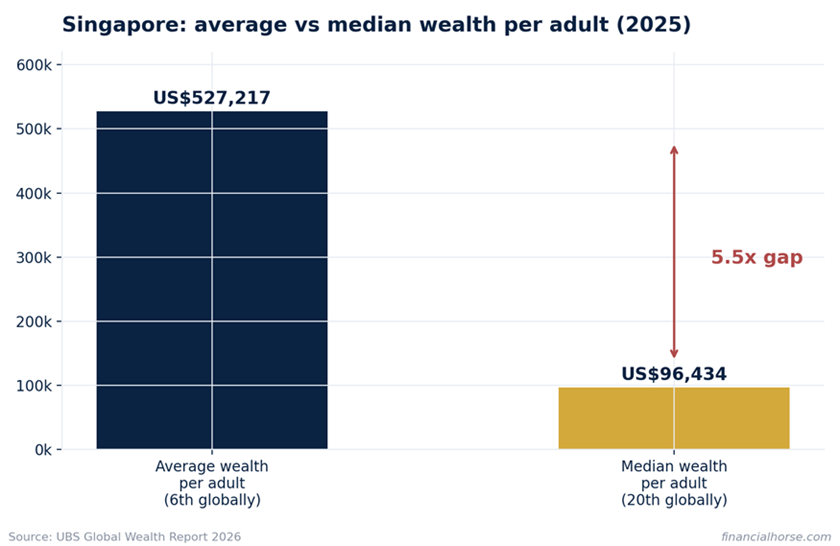
The median Singaporean adult is worth US$96,434 — roughly S$125,000 — which ranks just 20th globally.
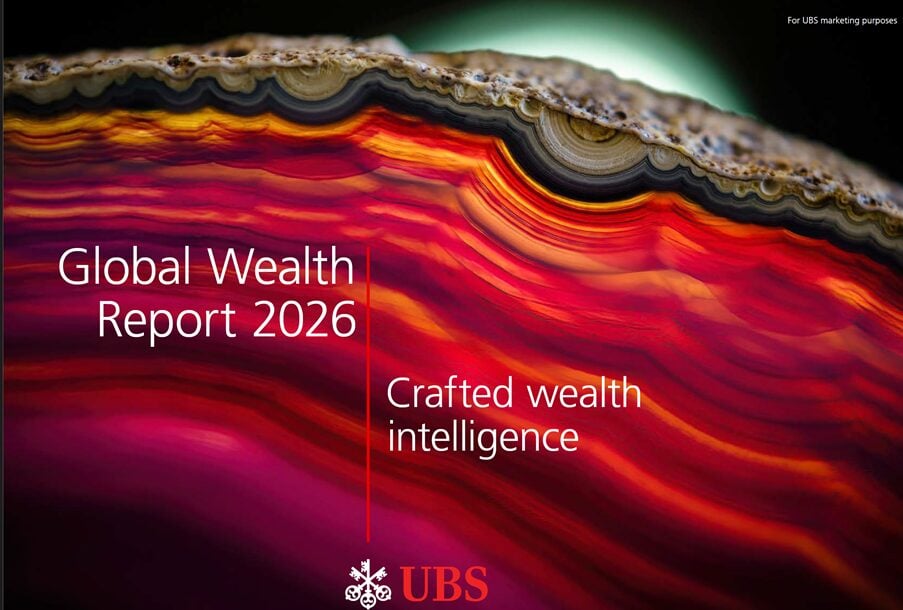
While Singapore now ranks 6th among the 56 markets UBS tracks for average wealth per adult.
In plain English, the “average” Singaporean is 5.5x richer than the “typical” Singaporean.
Earlier this year I wrote a full piece on what a good net worth in Singapore looks like using the older UBS data, so think of this as the 2026 update — and a closer look at why the headline and the typical Singaporean’s reality are so far apart.
Let’s dive in.
Singapore ranks 6th on average wealth — at US$527,217
Singapore ranks 6th out of the 56 markets UBS tracks, behind only Switzerland, the US, Luxembourg, Hong Kong and Australia.
Here’s the chart for reference.
Last year’s report ranked Singapore 8th at US$441,596, so the headline increase is roughly 19% in USD terms.
But UBS also warns that it updated some methodologies for this edition, so this is not necessarily a clean, like-for-like gain.
Part of the jump is also the measuring stick, not just the underlying wealth.
Because UBS converts every market into USD at year-end exchange rates, a weaker US dollar mechanically lifts non-USD wealth when translated back into dollars.
That currency effect turns out to be one of the biggest distortions in the report.
But Singapore ranks just 20th on median wealth — at US$96,434
Now for the number that doesn’t make the headlines.
Median wealth per adult in Singapore is US$96,434, which ranks 20th globally — down from 18th and US$113,976 in last year’s report (although again UBS cautions that some cross-edition comparisons are not like-for-like).
On the published figures, average wealth rose roughly 19% while median wealth fell about 15%.
That is a striking divergence, but because UBS changed parts of its methodology I would trust the direction more than the exact year-on-year percentages.
Still, it fits the report’s global conclusion: average wealth rose while median wealth declined in most markets.
You can see the gap below.
The average is pulled up by a relatively small number of very wealthy individuals and families — UBS counts roughly 244,000 USD millionaires in Singapore, including about 27,000 adults in the US$5m–100m bracket.
Singapore also added about 5,240 USD millionaires in 2025, a 2.2% increase.
That is why a relatively small change at the upper end can move the average much more than the midpoint.
The median tells you where the typical Singaporean actually stands.
At roughly S$125,000 in net wealth, the typical Singaporean adult is doing fine by global standards — but is nowhere near the S$682,000 average net worth.
One important caveat before comparing yourself with either number: UBS defines wealth as financial assets plus real assets (mainly housing), less debt.
In plain English, this is net worth per adult — not salary, cash in the bank, or household wealth before the mortgage.
Private pension assets are included, while human capital and unfunded state pension promises are not.
Does that mean the typical Singaporean household has only S$125,000?
No — UBS reports wealth per adult, not per household.
A couple’s home equity, cash, investments and funded retirement assets therefore need to be considered across 2 adults before comparing them with the median.
The USD conversion can also move your apparent wealth even when your flat, CPF and portfolio barely change in SGD terms.
In plain English, use the median as a rough benchmark, not a personal scorecard.
Is Singapore’s 5.5x average-to-median gap actually big?
A 5.5x gap sounds enormous.
But the honest answer depends entirely on what you compare it with.
The ratio is only a shorthand for concentration — useful, but not a complete picture of the wealth distribution.
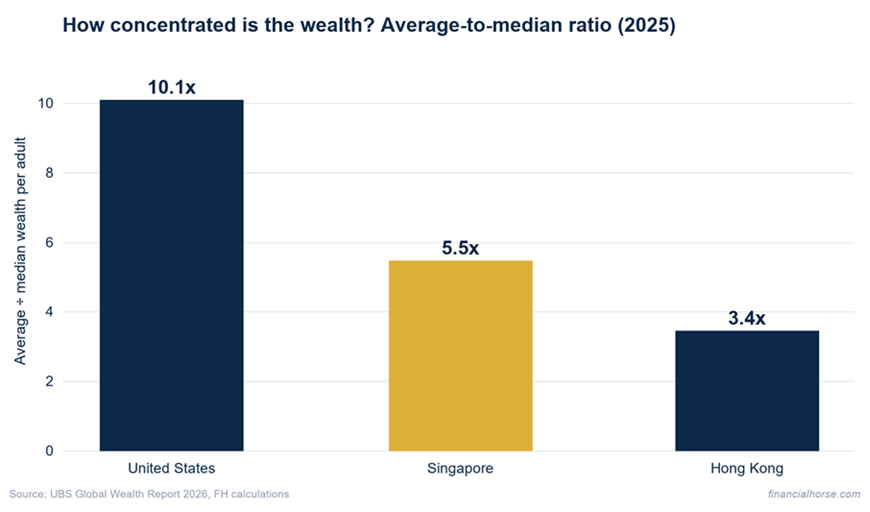
The US is the most extreme case in the report: 2nd on average wealth but only 28th on median, for a ratio of roughly 10.1x.
Hong Kong, by contrast, sits at roughly 3.4x.
Switzerland ranks 1st on average and 8th on median, suggesting a much broader spread of wealth.
In plain English, Singapore’s wealth gap is real, but the US is in a different league.
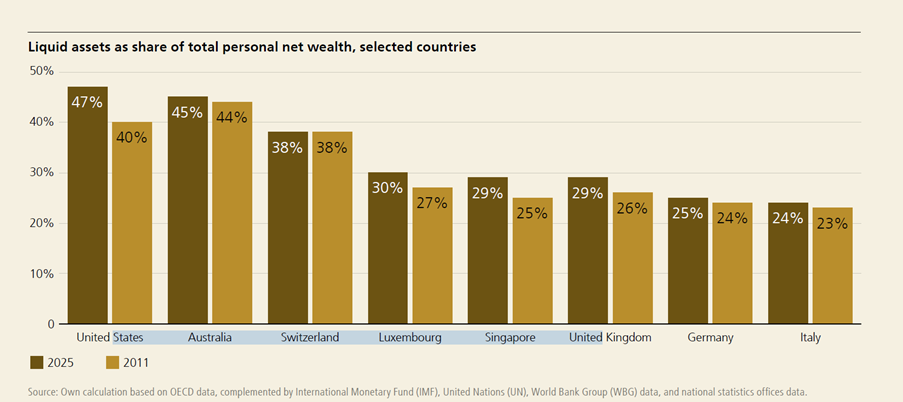
One more finding cuts against conventional wisdom: financial assets make up 63.8% of gross wealth in Singapore, above the UK (55.9%) and mainland China (51.9%).
That does not mean Singaporeans are unusually stock-heavy: the category includes retirement and insurance assets, so it is not a proxy for brokerage-account exposure.
UBS also estimates Singapore’s debt at 11.8% of gross wealth, close to Germany and the US and well below Australia or the UK.
But that is another national average: your own mortgage and liquidity position matter far more than the aggregate.
The 2025 global wealth boom was partly a currency mirage
Global personal wealth rose 10.8% in 2025 — the fastest pace since 2017.
But look at where the growth supposedly happened.
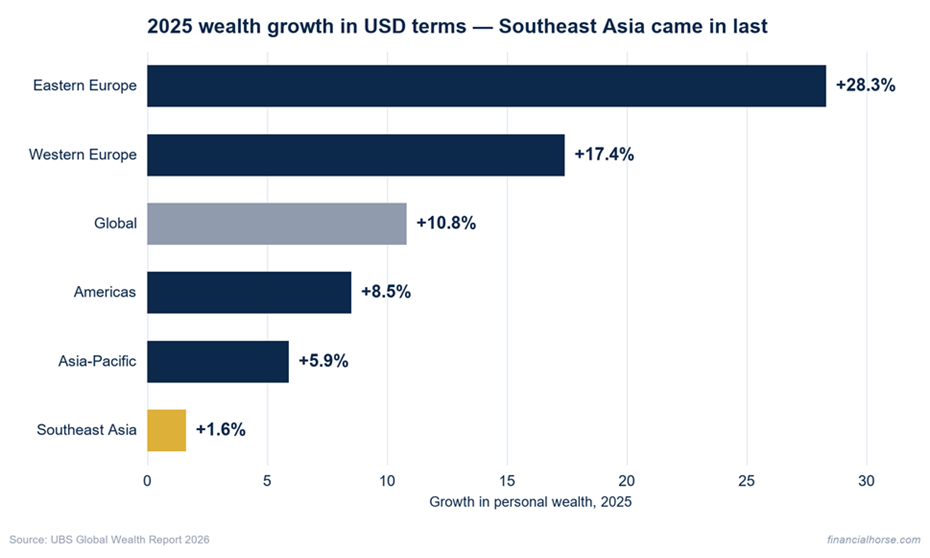
EMEA grew 17.5%, the Americas 8.5%, Asia-Pacific 5.9%, and Southeast Asia was the slowest sub-region at 1.6%.
On the surface, that looks like Europe out-created Asia by a wide margin.
That is too simple.
The reason is simple — UBS measures everything in USD, and the euro rose almost 9% against the dollar in 2025.
That translated European assets into more dollars even before you ask what the underlying assets earned.
In plain English, the regional table combines wealth creation with currency translation.
APAC’s share of global wealth fell from 36% to 32.8% — not because Asian wealth shrank, but because Europe’s re-rated harder in USD terms.
The broader lesson is the same one investors use for any headline: ask what is already in the number before acting on it.
Never miss a post! Follow Financial Horse by subscribing or following us on your favorite platform:
Subscribe to our mailing list for exclusive content straight to your inbox:
2 traps to avoid when reading wealth statistics
Trap 1 — the average hides the median.
Even as global wealth rose 10.8%, UBS says median wealth declined in most markets, widening the divide between the wealthiest and the broader population.
2025 was a great year for people who own assets, and a mediocre year for everyone else.
Trap 2 — the aggregate hides the mechanism.
UBS says South Korean billionaire wealth rose 139% in a year.
That sounds like an extraordinary year for existing Korean billionaires — until you see the headcount jumped from 31 to 52.
Headcount explains a meaningful part of the jump, but not all of it.
Hungary is cleaner: the billionaire count doubled from 4 to 8, which by itself explains a doubling in collective wealth even if nobody got richer.
The lesson applies to every financial headline you read: when an aggregate number moves dramatically, always ask whether it’s the same people getting richer, or different people being counted.
What I’m doing with my money
To be clear upfront: this is a data piece, not a market call, and nothing here changes my allocation.
My response is boring: stay invested in productive assets, leave long-term USD exposure unhedged, and avoid letting property plus CPF become the entire portfolio.
Nothing here makes me chase Europe after 17.5% wealth growth or dump Southeast Asia after 1.6%.
Those are backward-looking USD figures, not forward return forecasts — valuation and expected returns still matter more for fresh capital.
But it reinforces 3 key themes:
1. the average-median divergence is the single strongest argument for owning assets.
2025’s wealth gains tilted toward people holding assets, and the US$5m–100m group continued to expand rapidly.
Income alone does not compound; assets do.
Income creates the savings, but long-term ownership of productive assets is what compounds it.
Use your income to invest in productive assets.
2. FX cuts both ways for Singapore investors.
The same USD weakness that flattered European wealth numbers was a real drag on SGD-based investors holding US assets in 2025.
I still do not hedge my long-term USD exposure — the cost is not worth it to me — but I size US positions knowing FX can add or subtract mid-single digits in a year.
If your US allocation is large enough that a 5–10% currency swing would change your plans, that’s a sizing problem, not an FX problem.
That’s for equities though, where the upside is unlimited.
For bonds I almost always hedge my FX – no point taking on unlimited FX risk for a capped upside.
Three — diversify beyond property and CPF.
UBS expects future wealth gains to depend increasingly on access to investable assets and the ability to diversify.
For a Singapore investor, that means not letting the flat and CPF become the entire portfolio.
Both are valuable, but neither replaces a diversified pool of liquid, productive assets.
If you are already well above the median with a diversified portfolio, this report is confirmation to stay the course.
If you are at or below it with almost everything in property and CPF, the data is a reminder to build financial assets steadily.
Closing thoughts
So that’s how I’m reading the UBS Global Wealth Report 2026.
Singapore’s headline ranking is real, but the median describes most people’s reality — and globally, 2025 widened the divide between the wealthiest and the broader population.
Love to hear what you think though — does the US$96,000 median feel high or low, and does it match what you see around you?
This article was written on 10 July 2026. It will not be updated going forward.
My latest macro views, as well as my full stock watch and personal portfolio, are shared on FH Premium.