One of the most common questions we get in the Financial Horse community – is the PIMCO GIS Income Fund a good buy?
And we totally get it.
Because on the face of it, the numbers look almost too good to be true.
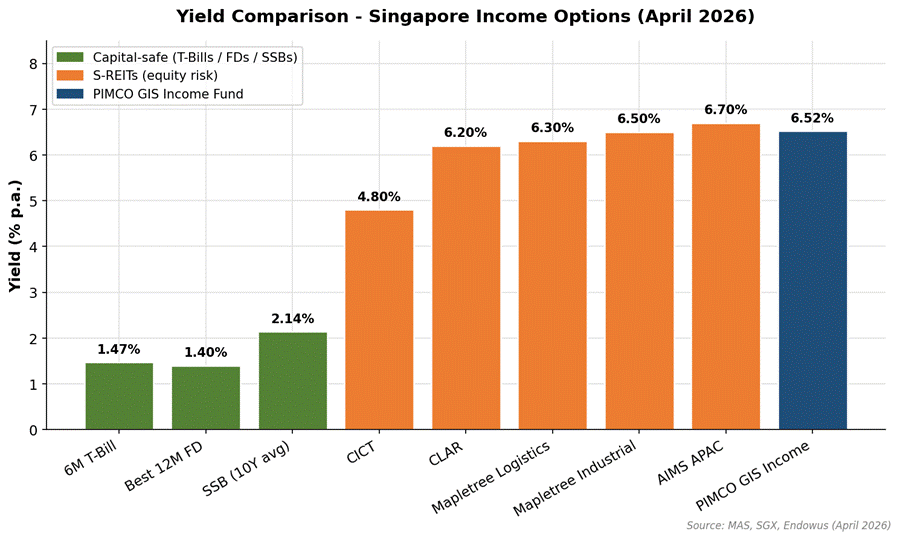
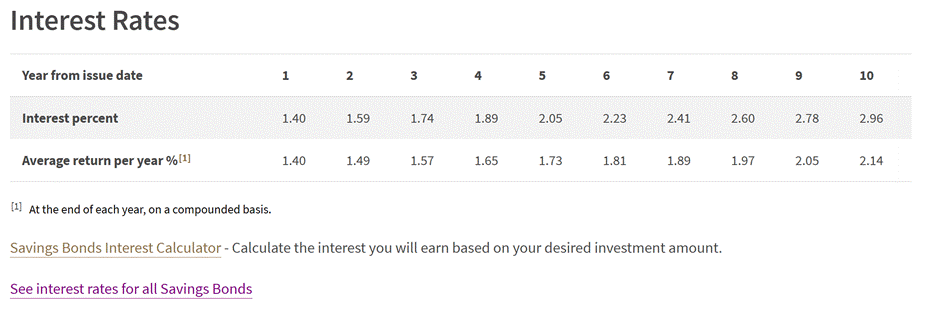
T-bills are at 1.47%. The best 12-month fixed deposit is 1.40%. Even the latest Singapore Savings Bond gives you just a 2.14% average over 10 years.
Meanwhile, the PIMCO GIS Income Fund is paying out a 6.5% yield, distributed monthly.
That’s 4x the T-bill yield, and 3x the SSB yield.
So… is this a no-brainer buy?
Well, as always, the devil is in the details.
In this article, I’ll walk through what the PIMCO GIS Income Fund actually is, how it stacks up against T-bills, SSBs, and REITs, and whether it deserves a place in a Singapore investor’s portfolio.
What is the PIMCO GIS Income Fund?
First things first.
The PIMCO GIS Income Fund is a flagship global fixed income fund run by PIMCO – the world’s largest bond manager.
It was launched in 2012, and today manages close to S$160 billion in assets.
Yes, you read that right – S$160 billion.
To put that in context, that is bigger than the market cap of every single stock listed on SGX except for DBS.
This thing is massive.
The fund is led by Dan Ivascyn, PIMCO’s Group CIO, which basically means you’re getting access to the one of the world’s top bond managers at the world’s biggest bond shop.
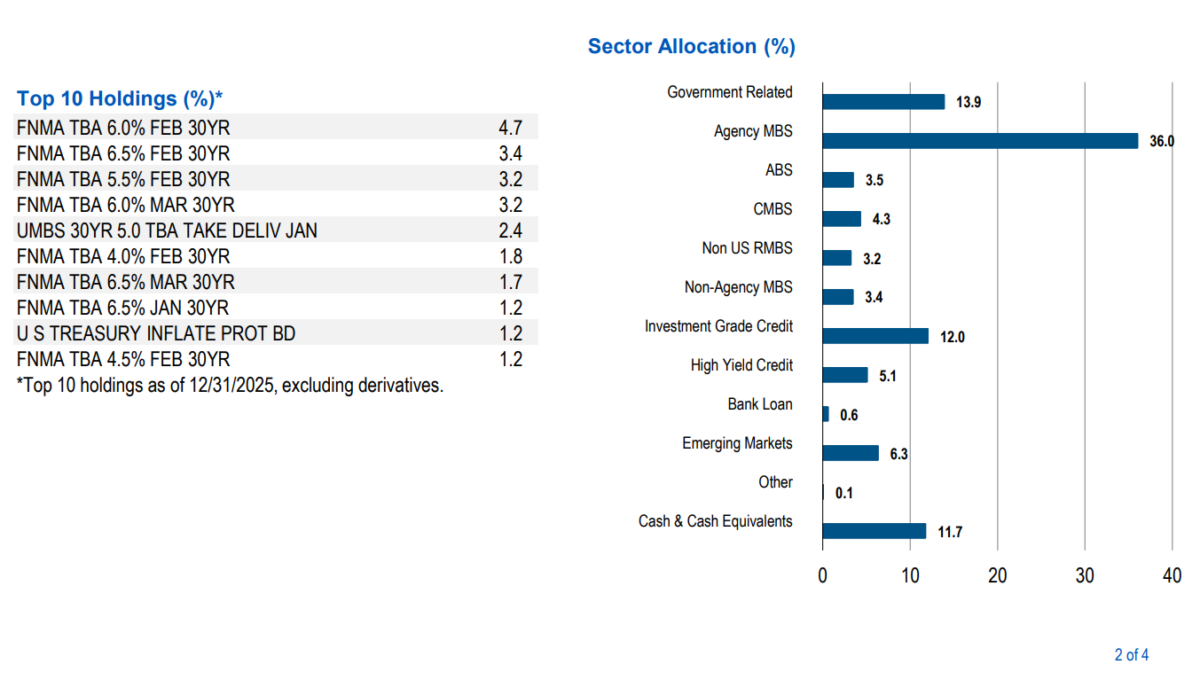
What does the fund actually invest in?
In plain English – it’s a multi-sector bond fund with a flexible mandate.
This means the fund manager can invest across:
- US Treasuries and agency mortgage-backed securities (MBS)
- Investment grade corporate bonds
- High yield credit (up to a limit)
- Emerging market debt
- Non-agency MBS and other securitised credit
Looking at the top holdings today, the portfolio is very US-centric – heavy allocation to 10-year Treasury futures, SOFR futures (i.e. short-term interest rate bets), and Fannie Mae agency MBS.
Duration is actively managed, and typically sits between 0 and 8 years.
For context, the current duration is on the lower end (3 – 4 years) – which means less interest rate sensitivity, but also less upside if rates fall.
How do you buy it in Singapore?
For Singapore investors, the cleanest way to access this is via the SGD-hedged distributing share class.
The SGD-hedged part is important – it neutralises most of the USD/SGD currency risk, so your returns track the underlying fund in SGD terms.
You can access this via platforms like Endowus, FSMOne, POEMS, or Tiger Brokers.
On Endowus you get access to the institutional share class at 0.55% p.a. fund fee, plus Endowus’ access fee of around 0.30%.
So all-in you’re looking at around 0.85% p.a. in total fees.
That’s not cheap for a bond fund, but not outrageous either.
What is the yield on PIMCO GIS Income Fund?
Okay, let’s look at the numbers that everyone cares about.
Here are the latest stats for the PIMCO GIS Income Fund (SGD-Hedged, Distributing share class) as of March 2026:
- 1-year payout yield: 6.52% (distributed monthly)
- Yield to maturity (YTM): 6.25%
- Fund fees (institutional class): 0.55% p.a.
- Volatility: 5.26%
- Max drawdown: -11.59%
- Fund size: S$160.2 billion
Now 6.52% looks incredible on the surface, especially compared to the 1.47% T-bill yield.
But the YTM of 6.25% is the more important number – this is what the underlying bonds in the portfolio are actually yielding today.
The 6.52% payout can include some return of capital, so the YTM is closer to the “true” earning power of the fund.
6.25%, net of 0.85% fees.
Means realistically you would be looking at around 5% net yield.
That’s still not too bad.
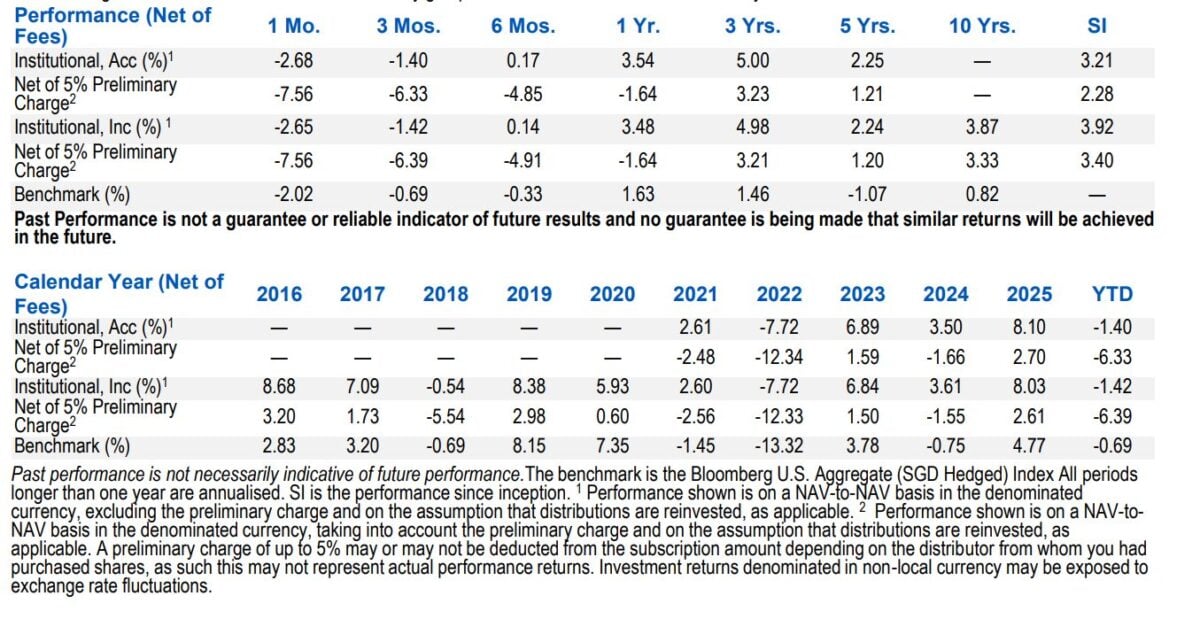
Historical returns – and the 2022 scar
Here’s how the SGD-hedged share class has performed over the years:
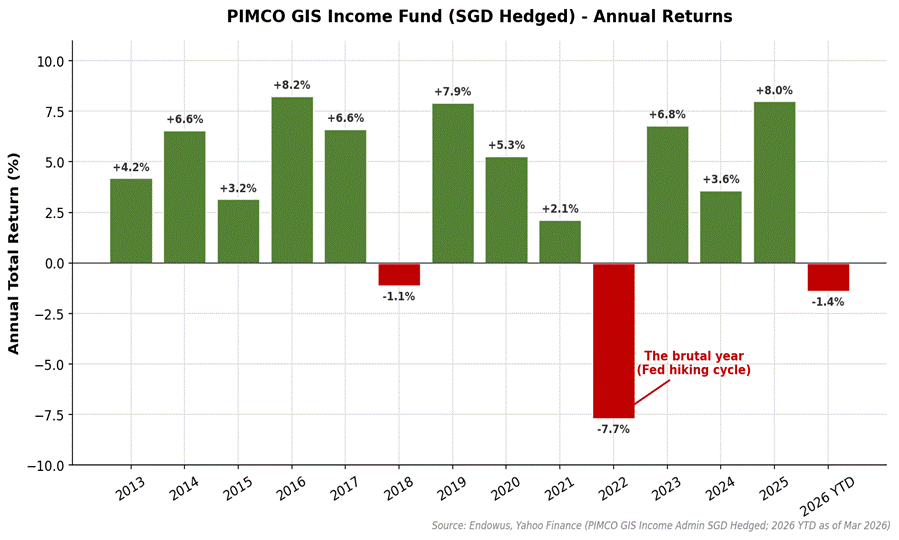
Long story short – in most years the fund delivers 3-8% total return.
But 2022 was brutal. The fund lost 7.7% in SGD terms as the Fed hiked rates from 0% to 5% in 12 months.
That’s the big caveat you need to internalise.
This is NOT a fixed deposit. The mark to market price of the bonds can and will decline when rates spike or credit spreads widen.
If you bought the fund in late 2021 expecting a stable “bond-like” return, you would have been down 8% plus by end of 2022, and it would have taken until mid-2024 to fully recover.
Compare with T-Bills, SSBs, and REITs
Here’s how the PIMCO GIS Income Fund stacks up against the other common yield options for Singapore investors:
| Metric | T-Bills (6M) | SSB (10Y avg) | Blue-chip S-REITs | PIMCO GIS Income |
| Headline Yield | 1.47% | 2.14% | ~5.5% – 6.5% | ~6.5% (6.25% YTM) |
| Capital Risk | None (hold to maturity) | None (redeemable at par) | High (equity-like) | Moderate (NAV fluctuates) |
| Max Drawdown | ~0% | ~0% | -40% to -50% | -11.6% (2022) |
| Liquidity | Secondary market, small markdowns | Monthly redemption at par | Daily (SGX) | Daily (T+3 redemption) |
| Tenor / Duration | 6 months | Up to 10 years | Perpetual | 0-8 years (active) |
| Minimum Amount | S$1,000 | S$500 (capped at S$200k) | 100 units | ~S$1,000 via Endowus |
| Fees | ~0% | S$2 per transaction | Brokerage only | ~0.85% all-in |
| Distribution Frequency | At maturity | Semi-annual | Quarterly / Semi-annual | Monthly |
Let me break that down a little further.
Never miss a post! Follow Financial Horse by subscribing or following us on your favorite platform:
Subscribe to our mailing list for exclusive content straight to your inbox:
Vs T-Bills
T-bills currently yield 1.47% for 6-month tenor.
The 4+ percentage point yield gap vs PIMCO (~6.5%) is genuinely large.
But – and this is important – T-bills are effectively risk-free if you hold to maturity. No credit risk, no duration risk, government-backed.
PIMCO GIS Income Fund is NOT a T-bill substitute. Full stop.
If you need capital preservation for an emergency fund or short-term savings goal, you should be in T-bills, not a bond fund.
Vs SSBs
SSBs are paying 2.14% average over 10 years in the latest May 2026 tranche.
Again, the yield gap vs PIMCO (~6.5%) is wide.
But SSBs are capital guaranteed by the Singapore Government, redeemable monthly at par, and have zero credit or duration risk to you.
SSBs are for the “safe” portion of your portfolio. PIMCO is sitting further out on the risk curve.
Vs REITs
This is where it gets more interesting.
Singapore REITs today offer dividend yields of:
- CICT: 4.8%
- Mapletree Logistics Trust: 6.3%
- CapitaLand Ascendas REIT: 6.2%
- Mapletree Industrial Trust: 6.5%
- AIMS APAC REIT: 6.7%
- Keppel REIT: 5.8%
So the PIMCO yield (net of fees) of 5.5% is roughly in line with what you’d get from a basket of blue-chip S-REITs today.
But here’s where the comparison gets interesting:
- S-REITs can drop 30-50% in a bad year (we saw this in 2022 and late 2023)
- PIMCO GIS Income Fund’s worst year was -7.7%
- S-REITs give you equity-style upside if rates fall
- PIMCO gives you moderate upside on rates falling, plus income stability
In other words – PIMCO offers a similar yield but with a meaningfully lower drawdown profile.
The trade-off? Less upside if rates crash lower and REITs rally hard.
Risks with PIMCO GIS Income Fund
Okay so far the PIMCO GIS Income Fund sounds pretty compelling.
6.5% yield, monthly distributions, managed by PIMCO, with lower drawdown than REITs.
What’s not to like – and what are the risks?
Well – a few things.
1. The payout is not the same as the yield
The 6.52% headline “payout yield” is the sum of distributions paid out over the last 12 months, divided by NAV.
But this can include return of capital.
Meaning – part of that 6.52% could just be the fund paying you back your own money.
The YTM of 6.25% is closer to the true earning power of the underlying portfolio.
And remember, that’s before fees of 0.85% or so – so net to you, you’re probably looking at 5.4% of true income yield.
Still attractive, but not 6.5%.
2. Capital is NOT guaranteed
This sounds obvious but bears repeating.
In 2022, the fund dropped 7.7% in SGD terms. Max drawdown during the period was close to -12%.
Bond funds can lose money. Often a lot of money in a short period.
When the Fed hiked rates aggressively in 2022, bond prices collapsed.
If you need your capital preserved, this is not the instrument for you.
Some of you have asked me if the -7.7% drawdown we saw in 2022 is indicative of the max drawdown for this bond fund.
The answer is obviously not.
2022 was not even a credit crisis, it was a mark to market drawdown from higher interest rates.
If we go into a true credit default cycle like 2008, expect to see much bigger losses.
So to be absolutely clear – this thing is NOT risk free.
3. Currency hedging has costs
The SGD-hedged share class neutralises most USD/SGD currency risk, which is good.
But hedging isn’t free.
The cost of hedging depends on the interest rate differential between USD and SGD.
Historically this has been a drag on returns by about 50-150 basis points a year.
PIMCO already bakes this into the returns you see, but it’s worth knowing that a “hedged” fund doesn’t mean “free returns in SGD”.
4. Rate cuts ahead = lower forward yield
The 6.5% distribution yield is based on today’s higher interest rate environment.
If the Fed continues to cut rates in 2026 and 2027, the fund’s yield will also drift lower over time.
You’ll get some capital appreciation as rates fall (which offsets the lower yield).
But don’t assume you’ll be getting 6.5% monthly distributions forever.
A year from now, the yield could easily be 5% or 5.5% before fees.
Potential Mark to Market losses
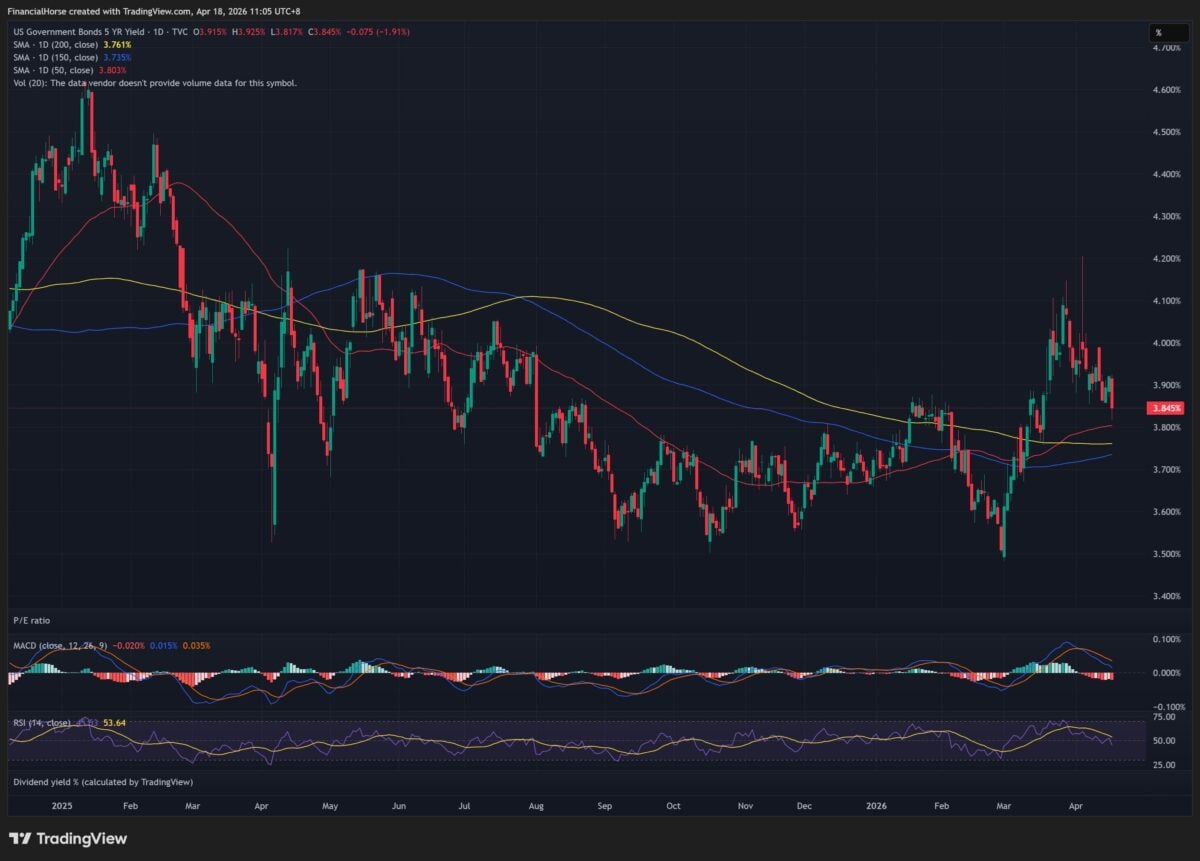
And on the flip side, if interest rates go up, you will see mark to market losses (bond prices trade inversely with interest rates, just like REITs).
That’s why we saw a sell-off when interest rates jumped on higher expectations due to the Iran war.
5. Credit risk is real
The fund holds a decent chunk of high yield and emerging market debt.
In a proper credit event (think 2008 or 2020), these can sell off sharply.
PIMCO is very good at managing this risk, and the fund’s multi-sector mandate gives Dan Ivascyn a lot of flexibility.
But it’s not zero.
If the Iran war restarts, and oil price goes to $200.
There could be credit risk + market to market loss on PIMCO GIS Income Fund.
My Personal View
So is the PIMCO GIS Income Fund a good buy for Singapore investors looking for yield?
My honest view – it depends on what you’re trying to solve.
It’s NOT a fixed deposit replacement
If you’re looking for a place to park your emergency fund, or savings that you need in the next 1-2 years, please do not put this into PIMCO GIS Income Fund.
Stick to T-bills, SSBs, or fixed deposits.
The 2022 drawdown was a reminder that bond funds can absolutely lose money. You don’t want to be forced to sell at a loss because you suddenly need the cash.
It is a *reasonable* alternative to REITs for yield seekers
If you’re looking at your income portfolio and thinking “I need some yield, but I’m worried about the drawdown risk in REITs” – then PIMCO GIS Income Fund starts to look like a potential alternative.
Monthly distributions vs quarterly/semi-annual for REITs.
Much lower historical drawdown (-12% vs -40%+ for REITs).
Plus diversification – US bonds behave very differently from Singapore property.
So for someone building a balanced income portfolio, I think PIMCO GIS Income Fund is worth looking at.
Closing Thoughts – PIMCO GIS Income Fund vs T-Bills, SSBs, and REITs
Full disclosure that I hold a position in PIMCO GIS Income Fund, which is primarily for the yield. It’s not a huge position, but I do hold some.
Coming back to the original question – is the PIMCO GIS Income Fund a good buy?
My simple answer: it depends what you compare it to.
Vs T-bills and SSBs – the yield is much higher, but so is the risk. Different instruments, different purposes.
Vs REITs – similar yield, monthly distributions, much lower drawdown. Arguably attractive if you’re worried about REIT volatility.
Just know what you’re buying – a bond fund with moderate risk, not a cash substitute.
Agree, or disagree with me? Would you buy the PIMCO GIS Income Fund today? Or stick with T-bills, SSBs, and REITs?
Love to hear what you think!
The content here is for informational purposes only and should NOT be taken as legal, business, tax, or investment advice. It does NOT constitute an offer or solicitation to purchase any investment or a recommendation to buy or sell a security. In fact, the content is not directed to any investor or potential investor and may not be used to evaluate or make any investment. Do note that this is not financial advice. If you are in doubt as to the action you should take, please consult your stock broker or financial advisor.
Thanks for this very useful comparison! I’m holding this fund position via Endowus (SRS) and Mari Invest (cash). Wanted to get your thoughts on this 2 platforms. I’m personally quite confused with how Endowus works – bought the position in Oct 2025 but I have not seen any distribution payout till now although it’s supposed to be monthly? Whereas for Mari Invest, it’s very clear how much the monthly payout and reinvestment is.
The all in fees for Endowus is slightly lower than MariInvest. But the user interface (UI) is indeed different, so up to investors to decide whether it’s worth paying more for the MariInvest UI.
For Endowus did you accidentally buy the accumulating share class? If so the distributions are automatically reinvested instead of paid out.
Cant seem to find it on Poems or Tiger Brokers or MooMoo etc
I bought in moomoo. Article says have fees but I don’t see Moomoo charging any fees.
The moomoo share class is the retail share class if I’m not wrong. So you pay for it via higher fees at at the fund level.
can I have the ISIN number of the PIMCO fund you are referring to in the article ? When I go into POEMS, I see afew PIMCO GIS Income funds but not sure which is the one you are referring to.
Why not look at iShares USD Asia High Yield Bond Index ETF instead?
That’s currently yielding 7.19%.
Asia high yield bond is a different risk profile. But in any case PIMCO GIS Income fund is only one option, am not saying this is the only option to consider. Others are perfectly fine as long as you understand what you’re buying into.
As the sage of Omaha said:
“Own what know and know what you own”
Hi FH, great article but your analysis is incorrect. The true yield, as you claim, is not 5.4%.
All fixed income unit trust/mutual fumds publish their yields in local currency terms.
In the instance of this PIMCO fund, 6.25% is predominantly in USD as most of their assets are in the US. Hedging cost for USD/SGD is currently more than 2.5% (and it changes everyday) so the net return to the end investor, including the expense ratio would be much lower.
If you look at the historical returns of the SGD class of this fund, it is closer to 3% on average.
Unfortunately, there is alot of mis information in the personal finance community about yields and future returns of bond funds. Influencers and self- proclaim gurus do not know how to analyze bond funds properly. People are misguided, thinking they are gettting 6% returns on their investments. To a certain degree, this is fraud.
I hope you can do something about it.
Just take his articles with a pinch of salt. If he is really that good, he won’t be writing all these for money.
Correct me if I’m wrong, but the historical 3% returns include the pre-fed hike periods of low interest rates right? If you only look at the post-fed hike yield post 23, the returns would be closer to 5%?
Just to add that I’ve held this position for about 1.5 years. Based purely on the distribution collected my return is approx 5-5.5% pa.
Likewise, I also been buying into PIMCO for about 2 years and my ROI is about 5.5%. I put my excess cash into it when NAV drops, and cash out when the NAV +2%, maintaining what I want to keep into it. All in all, it’s my biggest “cash” hold for Income Funds cos of it’s stability.
Thanks for the share – generally the same experience. Best to buy when interest rates are high, and sell when interest rates are low. So it is slightly more complex than a simple MMF.
Hi FH,
Using daily recorded NAV from PIMCO website to do the following calculation.
Your holding period of 18 months
Assuming your start date 01 Oct 2024, NAV was $8.58
Latest NAV at $8.21, it was as low as $8.03 recently
Your NAV losses is -$0.37 or -4.31%
Your monthly dividend paid out is $0.04547
$0.04547 x 18 months = $0.81846
or in percentage terms, 9.54%
Dividend received 9.54%
NAV losses -4.31%
Your returns for 18 months is 5.23%
So this means a 12-month return is 3.48%
Yup hence the mark to market pricing point in my article. Just like a REIT, if you buy it at low interest rates and sell it at high interest rates you will suffer a mark to market loss.
I actually got lucky in that I closed my entire position at the start of this year when interest rates were at record lows. And after the Iran war I bought back a half position.
So I generally view this like a REIT and will take profit when interest rates are low, and buy it back when interest rates are high.
Dear FH,
https://www.pimco.com/sg/en/investments/gis/income-fund/e-sgd-hedged-income
Using hard evidence data from PIMCO website, the last 3 distributions has 51.94%, 65.06% and 46.29% PAID OUT FROM CAPITAL.
You are practically getting paid with your own funds.
This fund has been paying out from capital since June 2017.
From 2017 to now, the fund size has grown tremendously.
The local banks have been pushing this product aggressively.
I am pretty sure Pimco give the banks a generous cut.
The fund has been paying out a higher and higher percentage out of capital, it just look like a ponzi scheme where new money is used to pay old investors.
Not to mention that the NAV has continued to drop despite the Fed cutting 175 bps. While one can argue that long-term yields remain high, thus the NAV continues to be under pressure, it is difficult to see any significant recovery in the NAV in the future as the fund pays so much out of its capital for the monthly distribution.
With respect to the NAV, once again using hard data as evidence from the Pimco website, the total return from 01 Jan 2022 to 09 Apr 2026 is a pathetic 1.67% per year.
Total returns = Dividends received minus NAV loss
Anyone can calculate this using the excel sheet on Pimco website.
This is publicly available data.
On 01 Jan 2022, the NAV was $9.99
On 09 Apr 2026, the NAV was $8.15
If I am not wrong the paid out of capital is an accounting thing where from a cash management perspective, sometimes they use the maturing bond funds to pay the distribution.
Yes – if you buy the institutional share class the bank / broker selling the fund will earn a trailer fee, this is well known in the industry.
Using Jan 22 NAV to compare vs Apr 26 NAV will naturally lead to this outcome because interest rates were rock bottom in Jan 22 vs April 26.
In my view for most of these yield instruments it is better to analyse them in the zero interest rate era, and post zero interest rate era.
But I mean there are so many investments out there. If this one doesn’t meet your criteria for an investment, just skip it.
Hi FH,
Thanks for the prompt reply.
I doubt it is an accounting thing.
As indicated and copied from the PIMCO website, the current yield of this fund is 4.38%.
Current yield is a security’s annual income (interest or dividends) divided by its current price.
Yields reported gross of fees, the deduction of which will reduce the yield.
If 4.38% is before the fund manager’s fees, then after deducting the fund manager’s fees, the fund yield is likely in the low 3%, perhaps this is why they need to pay out so much from their existing cash position every month.
The last 3 distributions has 51.94%, 65.06% and 46.29% PAID OUT FROM CAPITAL.
I have been following your blog for years and greatly appreciate your posts.
Thus i am trying to understand from your perspective why this is worth investing and what I am missing out.
Because no matter how i looked at this, it just seems really high risk for the normal folks.
Anyone that buy this Pimco fund with a buy-and-hold approach is likely to earn very little return, almost comparable to a fixed deposit.
If you buy through the banks and use leverage to borrow, after paying the bank fat commission and interest on your borrowings, you are effectively in the red.
I bought this in 2025 based on the Pimco brand using Moo Moo and Tiger.
Zero fees for both buying and selling through both Moo Moo and Tiger.
After learning more about the fund, i realised that it is very difficult to earn a decent return and sold off my position for a 2% gain.
Thanks for the reply. I took a deeper look at the fund docs.
For the Singapore-Hedged (“Income II”) share class that Singapore retail investors typically buy, the bulk of what PIMCO labels “paid from capital” is actually FX hedge carry — real economic return reclassified as “capital” under Irish UCITS accounting, not a refund of principal. That and Management fees charged to capital – an accounting election that grosses up “distributable income” at the cost of reducing NAV. However, once you back that out, there has been some genuine NAV erosion over 5–10 years, so I am wrong in that it is not purely an accounting thing either.
I think ultimately it depends what you’re comparing this with. If you compare vs T-Bills / SSBs it’s a no brainer that PIMCO risk level is way higher. If you compare with say a 6% yielding REIT today, I would say it’s a different nature of risk, but not necessarily significantly more risky than a REIT.
Bottom line in my view is that there is no free lunch in this world. There is a reason why this thing trades at a 6% yield. But for investors who want to diversify risk away from pure REITs, I think it’s an alternative to consider. Just don’t go in thinking this is risk free yield.
I myself hold a combination of REITs and PIMCO, but sizing wise the REITs is much higher.
Just to add that if you buy via MooMoo and Tiger, you are buying the retail share class which has higher fees (vs Endowus which is the insititutional share class). There is no sales charge but that is because you pay a higher fund fee which the fund manager then pays to the broker via trailer fees. Endowus has the lower all-in fees the last I checked.