Singapore couples are marrying later and making big money choices earlier.
It’s not uncommon to hear a proposal that begins with “Will you BTO with me?”.
Household incomes rose in 2025: median monthly household market income rose to $12,446.
For married couples with young kids, spending is highly concentrated: housing + food + transport + education = 70% of expenditure.
So what’s changing in how couples earn, spend, and plan their money in Singapore today? Let’s look at the most interesting shifts.

This article was written by a Financial Horse Contributor.
Marrying later shifts money stress into a tighter window
The median age at first marriage in 2024 was 31.1 for grooms and 29.6 for brides, continuing the trend of later marriages.
Later marriage can mean more time to build savings — but it can also compress big costs (home, reno, kids) into fewer years.
A later marriage often compresses big-ticket decisions (home, renovation, kids) into a shorter span — which can make cashflow feel tighter even when incomes are higher.
This is why the “money talk” is moving earlier.
Unmarried couples can apply for a flat under the Fiancé/Fiancée Scheme, but HDB requires them to solemnise the marriage within 3 months of key collection. That rule alone forces real planning.
Weddings are becoming simpler
A Straits Times article surveys wedding guests comparing hongbao “market rates”.
It notes lunch weddings can be $100–$200, while dinner “can breach $400” for some venues.
CNA’s commentary adds that once a “market rate” exists, giving can start to feel transactional and perhaps even burdensome.
Net effect: more couples are quietly trying to keep things simpler — not because they don’t care, but because they don’t want the celebration to become a money stress test for everyone.
Inflation changes the order of life plans – everything is getting later and later
Many couples are putting off kids due to lifestyle pressures.
This seems to be a consistent decision pattern: costs don’t just raise budgets; they delay decisions.
When housing or wedding spending runs hot, kids often get pushed “one year later”, then “after the next bonus”, then “when things stabilise”.
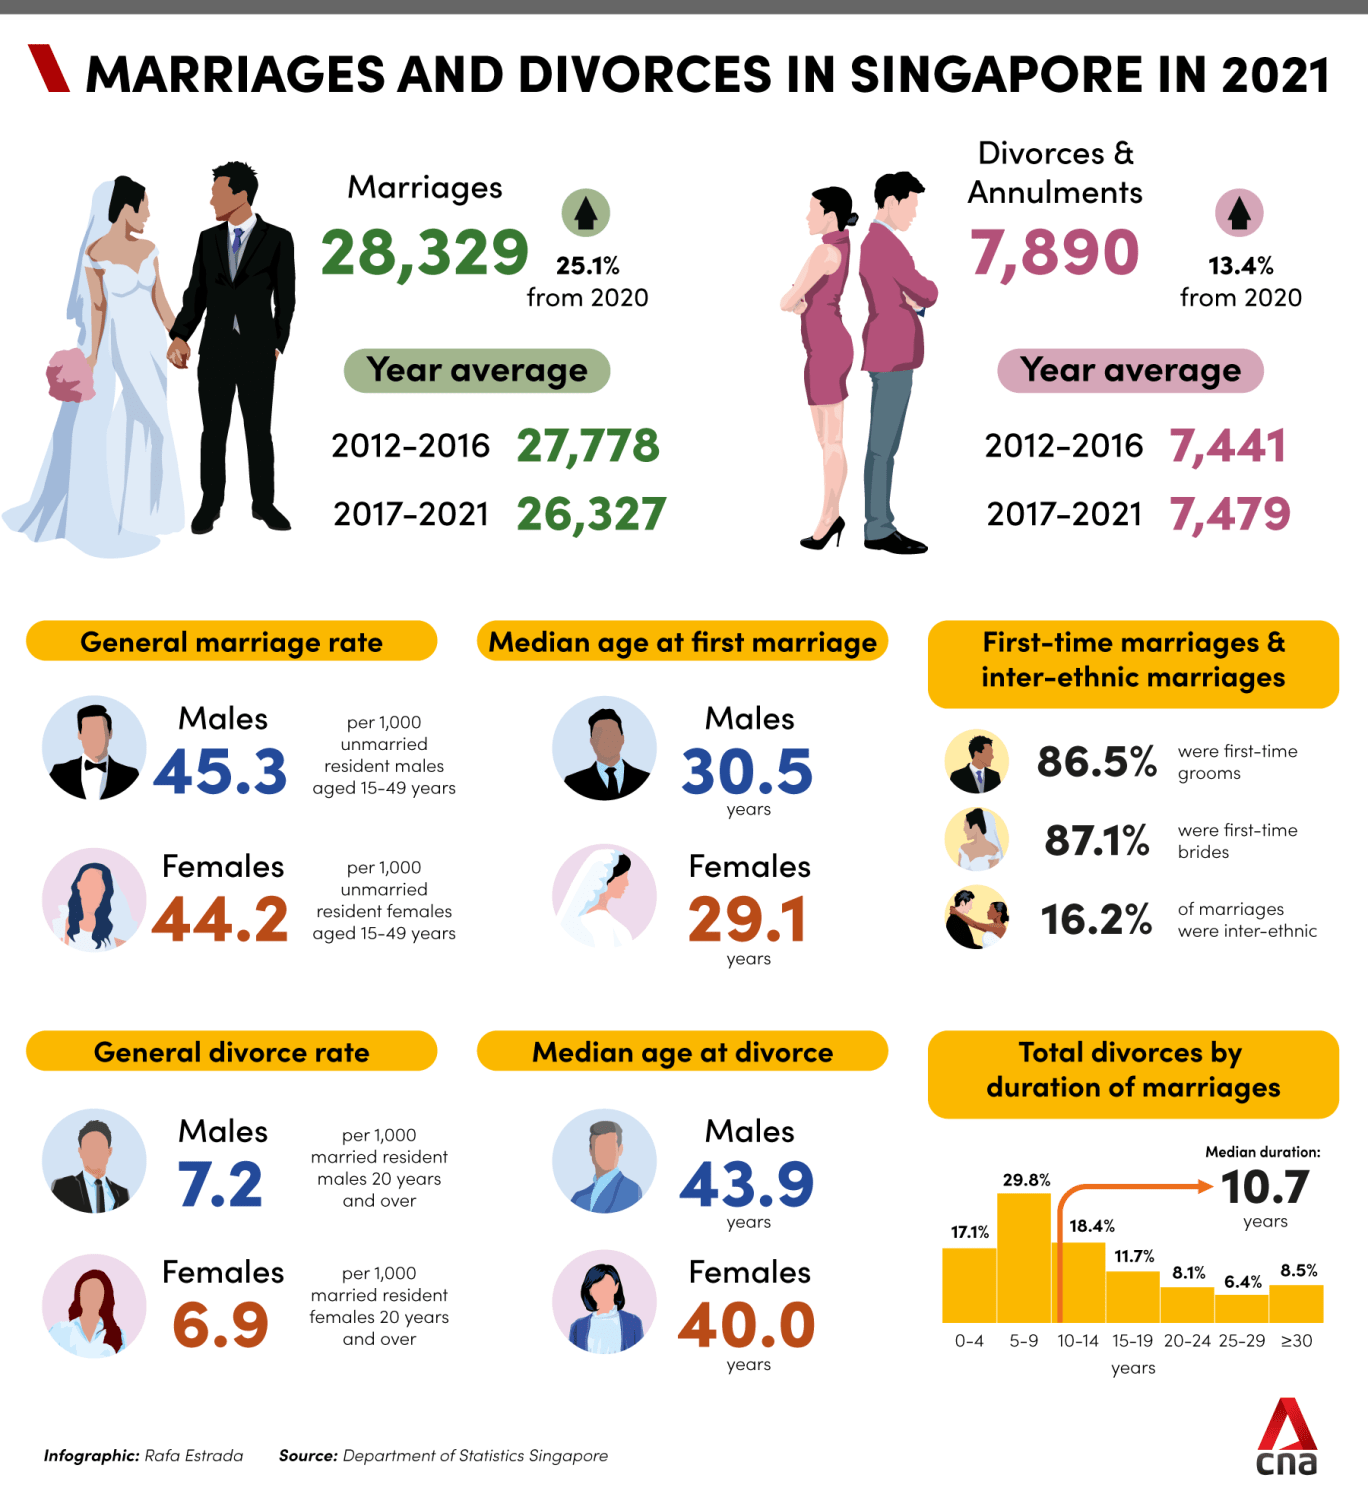
Divorce rates are lower than 10 years ago, Divorce peaks at 5 – 9 years of marriage
SingStat reports 7,382 marriages ended in divorce or annulment in 2024.
At the same time, divorce rates (per 1,000 married residents aged 20+) are lower than 2014.
The “timing” pattern is interesting to note:
- Median marriage duration at divorce is 11.1 years.
- Divorce is most common at 5–9 years of marriage.
That 5–9 year window is also when many couples get hit by the triple-load: housing upgrades/renovation, childcare/education bills, and peak career stress.
The stats don’t prove cause — but they do tell you where pressure tends to show up first.
SingStat notes the highest jump in dissolutions tends to happen from the 5th to before the 10th anniversary, compared with other 5-year intervals.
Talk about money early on – budgeting, debt limits, savings rules, who pays what, and do it early before big expenses hit during the 5 – 9 year window.
Kids make spending concentrate into four buckets
SingStat’s deep dive on married couple households with young children (HES 2023) shows the shape of family finances:
- 333,650 households (about 23.5% of resident households)
- Average monthly income $21,435 and expenditure $8,577
- Housing + food + transport + education = 70.4% of spending
Note: expenditure here includes imputed rent for owner-occupied homes (so it’s not all cash leaving the bank).
The lifestyle signals are telling too: 30.0% employed a domestic helper and 55.4% owned car(s) — both choices that can swing monthly cashflow hard.
Dual income is the biggest single stabiliser (but it needs a “fairness” plan)
Census 2020 shows the median monthly income from work for married couples was:
- $11,101 when both spouses are employed
- $5,070 when only the husband is employed
- $3,213 when only the wife is employed
MTI also stated that about 53% of married couples in resident households had both spouses employed (Census 2020).
Relationship experts stress agreeing on a shared “baseline lifestyle” and talking upfront if one person wants more, rather than expecting the other to silently absorb the cost.
Fair = we can both afford our shared life without stress.
Equal = we pay the same dollar amount. (Only works when incomes and obligations are similar.)
A common “equity” method is to contribute to shared needs in proportion to income (e.g., one pays 60%, the other 40%).
If incomes change, if one person takes on a big non-money load (studies, caregiving), or if debt appears, there needs to be communication again to update the plan.
CNA quotes a psychologist: financial transparency is like checking the fuel level before a trip—“not comparison,” but gauging the road ahead together.
That means being clear about: income, debts, commitments, goals—without having to justify every small purchase.
Never miss a post! Follow Financial Horse by subscribing or following us on your favorite platform:
Subscribe to our mailing list for exclusive content straight to your inbox:
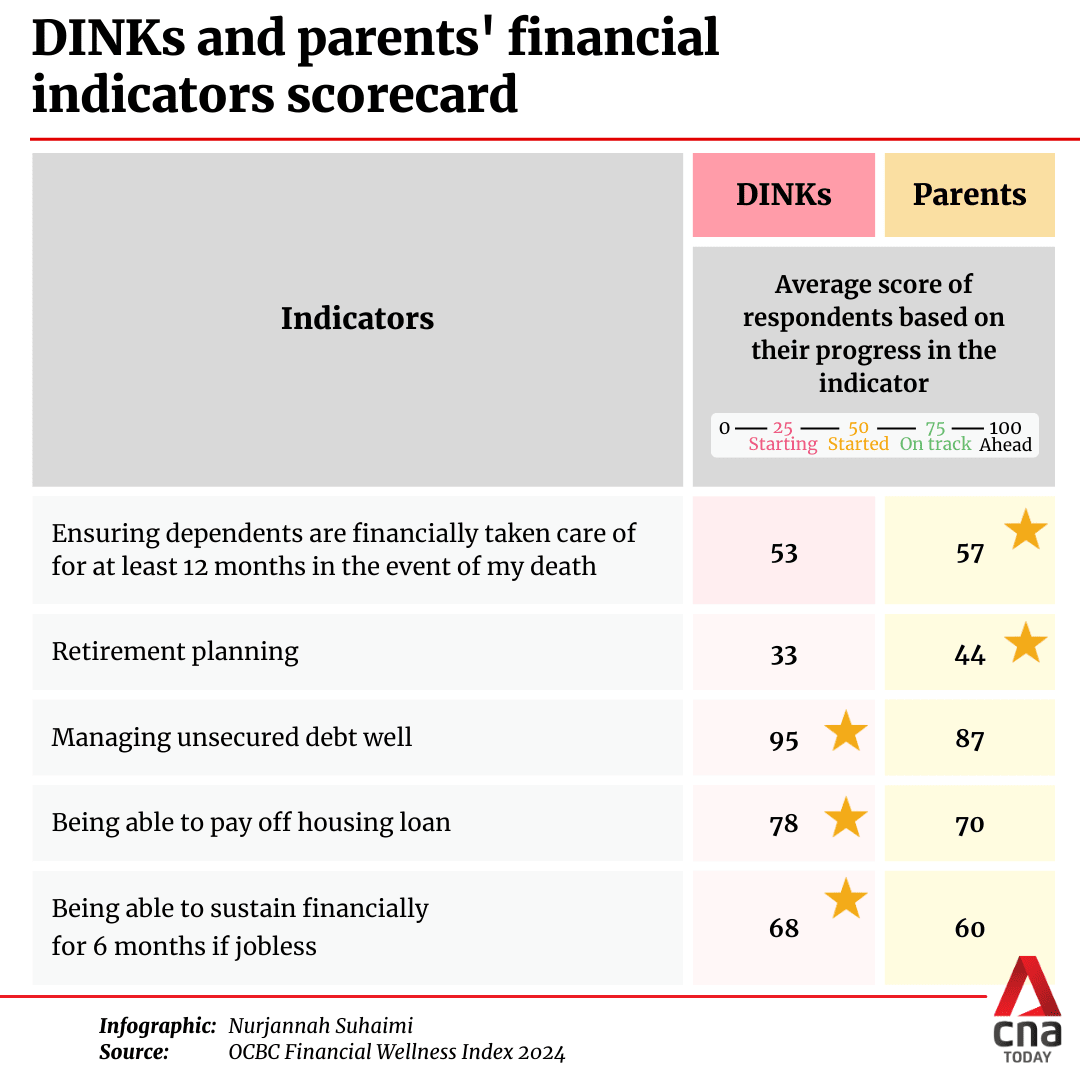
DINK life looks rich day-to-day, but retirement planning can lag
CNA reports that DINK couples tend to seek retirement planning advice later (often early 40s) than couples with kids.
OCBC’s Financial Wellness Index release echoes the same concern: DINKs can lag parents on several wellness indicators, especially retirement planning.
Lifestyle takeaway: no kids can free up cash, but it can also delay urgency — and urgency is often what turns income into long-term security.
“Income” is broader than salary — and CPF-linked flows matter
SingStat’s latest income release (2025 data) shows median monthly household market income rose from $11,558 (2024) to $12,446 (2025); per household member, $3,837 → $4,160.
Employment income remains the largest source, but its share fell to 79.6%.
For the lowest income decile, SingStat notes large shares from investment income (40.9%) and other income (37.0%), mostly tied to CPF interest and CPF payout schemes.
That matters for couples because it changes how you think about “safety”: not just salary, but also steady streams and buffers.
Concluding thoughts
The modern “secret” to marriage and finances is open and honest communication.
Agreeing early on three boring but powerful things: what “enough” looks like (wedding, home, kids), how you’ll handle uneven income seasons, and what must stay transparent (debts, big commitments, shared goals).
That kind of clarity doesn’t make a relationship less romantic — it protects it, especially in the 5–9 year squeeze when pressures tend to peak.