For those of you who haven’t been following closely.
Singapore Exchange (SGX) shares are absolutely on fire.
This stock has more than doubled over the past 2 years – outperforming even DBS Bank.
Some of you have asked me for my views on SGX stock.
So I wanted to take a closer look in today’s article.
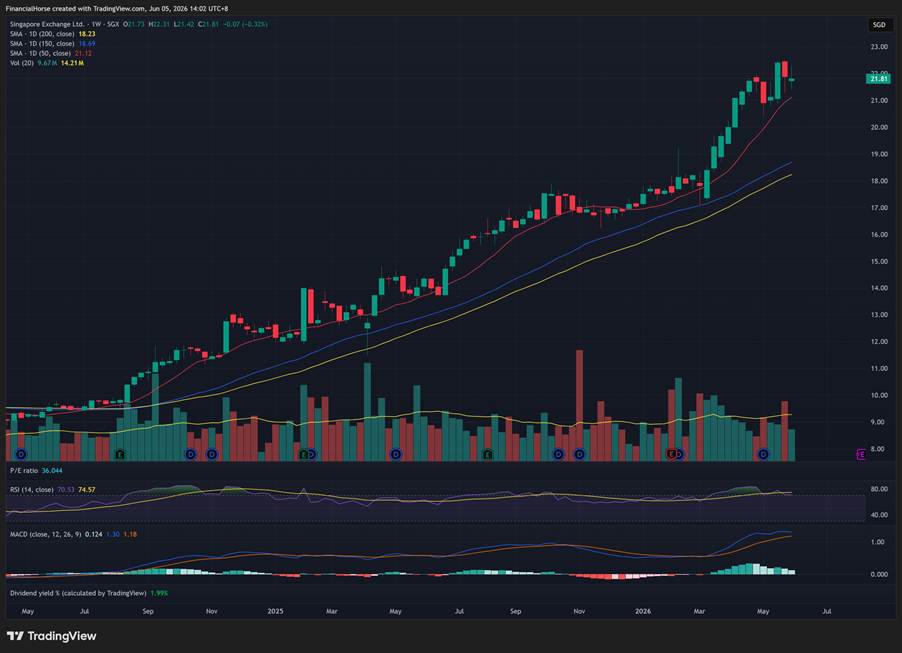
Singapore Exchange shares up 130% in 2 years – far outperforming even DBS Bank
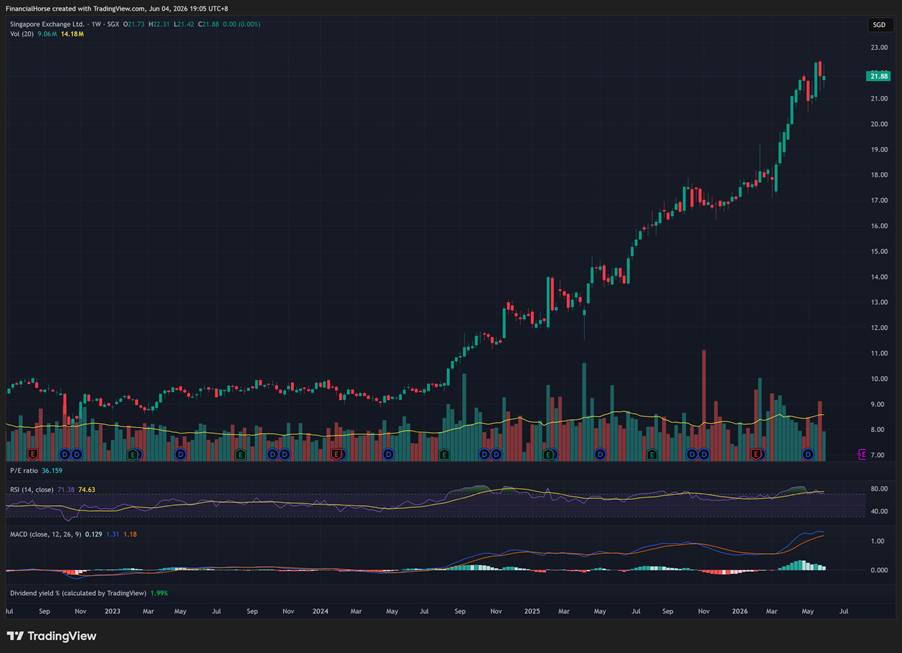
Here’s the chart for reference.
SGX was at $9.8 in July 2024.
As of June 2026, the stock sits at $21.88 – more than doubling.
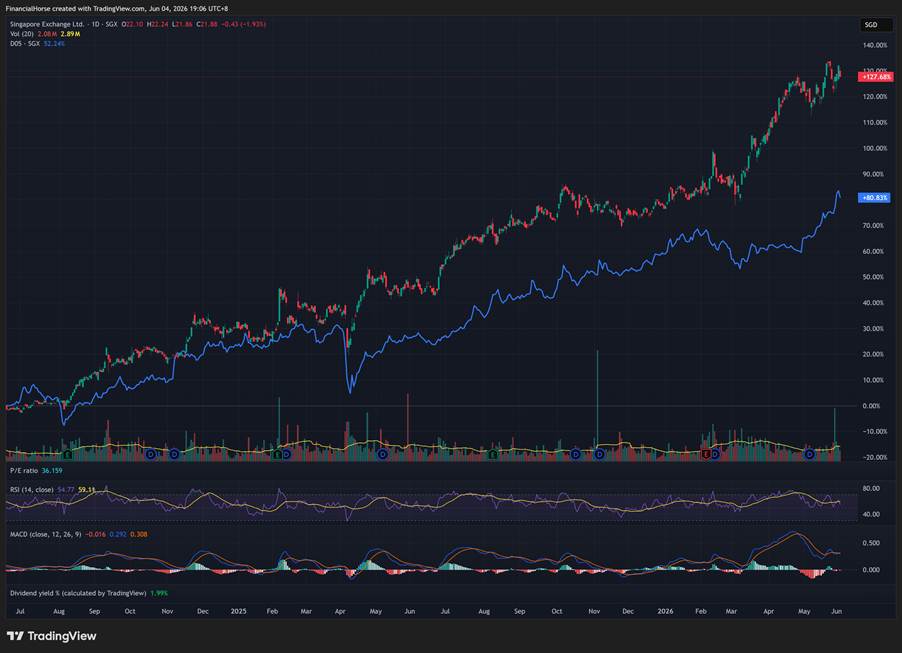
I’ve compared SGX against DBS Bank (blue) below.
You can see how over a 2 year period, DBS bank is up 80%.
Meanwhile SGX is up a whopping 117%.
Yes this is before dividends, but even after adjusting for dividends SGX is still the clear winner.
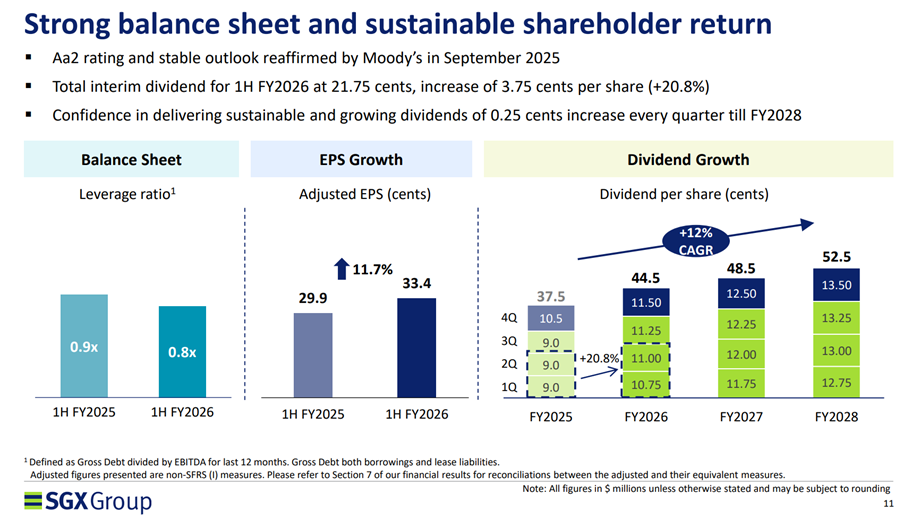
SGX stock pays a 2.0% dividend today
At current price, SGX pays a 2.0% dividend.
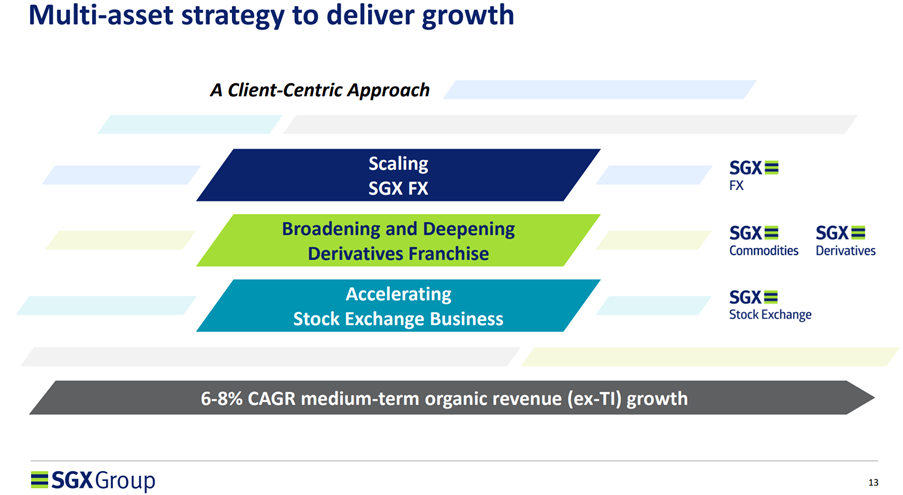
SGX is projecting a 12% growth in dividend each year until FY2028, and using those numbers works out to a 2.4% dividend yield in FY2028.
That’s still low when you compare it to the likes of DBS or OCBC, which pay a 4%ish yield today even after stripping out special dividends.
Of course, SGX’s strong return the past 2 years came mainly from capital growth rather than dividends, so the question is whether that can be sustained going forwards.
What is SGX’s business?
So what exactly is SGX’s business and why are they doing so well?
SGX makes money from five main activities:
- Trading and clearing fees — every time investors trade shares, REITs, ETFs, futures, options, FX or commodity derivatives.
- Settlement and depository fees — CDP custody, settlement, corporate actions and related services.
- Listing fees — companies and bonds paying to list on SGX.
- Market data and connectivity — brokers, institutions and trading firms pay for data feeds, access, co-location and connectivity.
- Indices and other platform businesses — index licensing, Scientific Beta and other platform services.
The bulk of the revenue (65%) comes from 2 components:
- Equities – Cash
- Equities – Derivatives
Cash equities is SGX listed stocks – which SGX makes money based on trading volume and activity.
Equity derivatives is largely the Asia benchmark derivatives – which have picked up strong demand from institutional investors looking to invest in Asia or to hedge certain positions.
This is very profitable – even higher margins then the cash equities business.
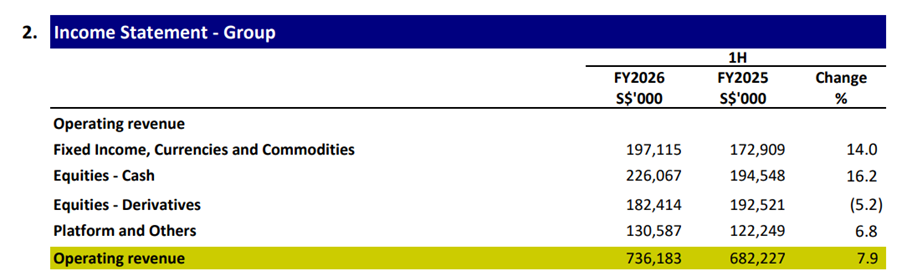
After equities, the biggest is FICC (fixed income, commodities, currencies) at 18.9% of profits.
Following by platform (basically selling data and connectivity) at 15.6% of profits.
| Segment | What it includes | FY2025 net revenue | Revenue share | FY2025 operating profit | Profit share |
| Equities — Cash | Singapore shares, REITs, ETFs, listing, trading, clearing, CDP settlement/depository | S$392.7m | 30.3% | S$243.9m | 32.8% |
| Equities — Derivatives | FTSE China A50, GIFT Nifty, Taiwan, Nikkei, MSCI Singapore, single-stock futures | S$345.9m | 26.6% | S$242.5m | 32.6% |
| FICC | Fixed income, FX, OTC FX, currency futures, iron ore, rubber, freight derivatives | S$321.6m | 24.8% | S$140.5m | 18.9% |
| Platform & Others | Market data, connectivity, indices, Scientific Beta, other platform services | S$238.0m | 18.3% | S$116.0m | 15.6% |
| Total | S$1,298.2m | 100% | S$742.8m | 100% |
SGX’s business is NOT about IPOs
Most of you may think that the SGX is a dead exchange because of the lack of IPOs.
I mean, that’s not exactly wrong, but the point I wanted to make is that SGX today does not make the bulk of its money from IPOs.
In FY2025, combined listing revenue was only S$32.7 million, or roughly 2.5% of group net revenue.
That’s miniscule.
The real engine is:
SGX profit = market activity × fee capture × operating leverage + recurring data/connectivity income
In plain English – the more people trade on the SGX, the more money SGX makes.
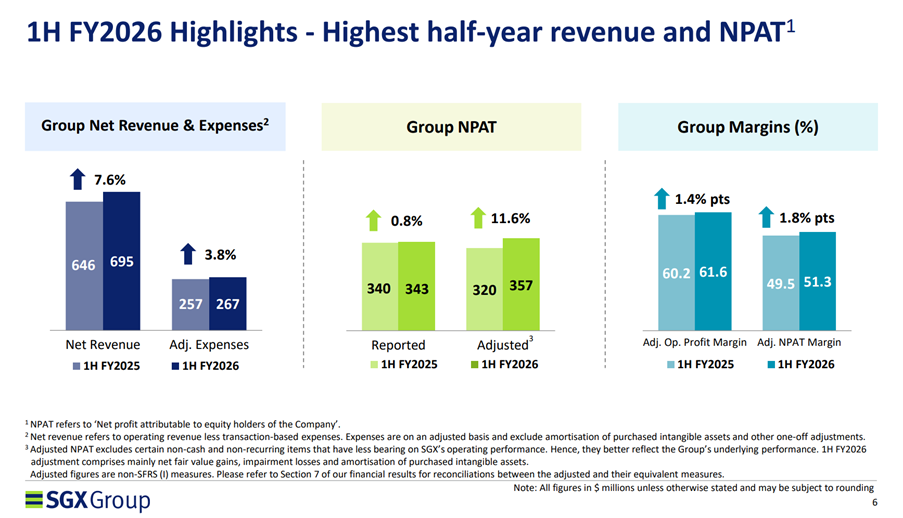
You can see how earnings growth is pretty solid.
7.6% growth in revenue, and 11.6% growth in profit.
So despite all the lack of listing, the core SGX business is still performing well, because investors are still trading equities, derivatives and FICC on the SGX.
What is SGX’s economic moat?
In my view, SGX’s moat is twofold.
The first is Singapore cash equities.
Stocks like DBS, OCBC and UOB are listed and traded on the SGX. When these stocks do well, trading volume rises and SGX earns more. So the strong performance of SGX-listed blue chips and REITs feeds directly back to SGX itself.
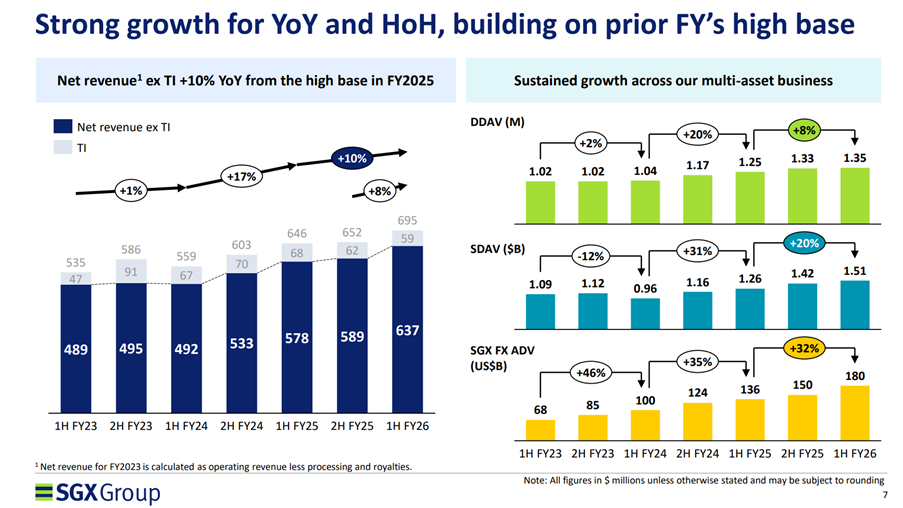
The second is SGX’s Asian derivatives franchise.
Its crown jewel is the FTSE China A50 Index Futures — the de facto global gateway for offshore China equity exposure — alongside a deep stable of FX futures (USD/CNH, INR/USD), plus Taiwan, Japan and commodity contracts. And despite all the talk about being displaced by Hong Kong, the volumes here keep hitting records.
Derivatives is also one of those businesses where liquidity begets liquidity. The more people trade on the SGX, the better the liquidity, which pulls in still more participants. Once you’ve built that kind of liquidity and network effect — and global institutions start to depend on it — you become very hard to displace.
So the bull case is simple: SGX-listed stocks do well, and the Asian derivatives business keeps attracting institutional flow.
The bear case is the mirror image: SGX-listed stocks underperform and get shunned by investors, while the derivatives franchise gets chipped away by rival Asian exchanges.
That’s it in a nutshell.
Never miss a post! Follow Financial Horse by subscribing or following us on your favorite platform:
Subscribe to our mailing list for exclusive content straight to your inbox:
Valuations of SGX
Here are the current valuations of SGX.
| Metric | valuation |
| Share price | S$21.88 |
| Market cap | ~S$23.45bn |
| Trailing P/E | ~36.2x |
| Annualised FY2026 P/E | ~32.8x |
| Dividend yield | ~2.0% |
| 52-week range | S$13.69 – S$22.50 |
| Analyst target | ~S$20.98 average |
SGX is trading at about 36x trailing earnings and ~33x annualised FY2026 earnings — expensive by its own history.
At S$21.88, the dividend yield is only ~2.0%, so this is no longer a cheap dividend compounder.
Valuation only works if investors believe SGX has entered a structurally higher-growth regime from equities revival + derivatives + FICC.
Benchmarked vs other Stock Exchanges
Benchmarking vs other stock exchanges yields a similar story.
| Company | Trailing P/E | Dividend yield |
| SGX | 36.2x | 2.0% |
| HKEX | 27.0x | 3.1% |
| Japan Exchange | 26.6x | 3.0% |
| Nasdaq | 26.2x | 1.4% |
| CME | 24.6x | 1.8% |
| Cboe | 24.4x | 1.0% |
| Deutsche Börse | 21.8x | 1.7% |
| Euronext | 21.6x | 1.9% |
| ICE | 20.2x | 1.5% |
| ASX | 17.6x | 4.5% |
| LSEG | ~37.8x | ~1.7% |
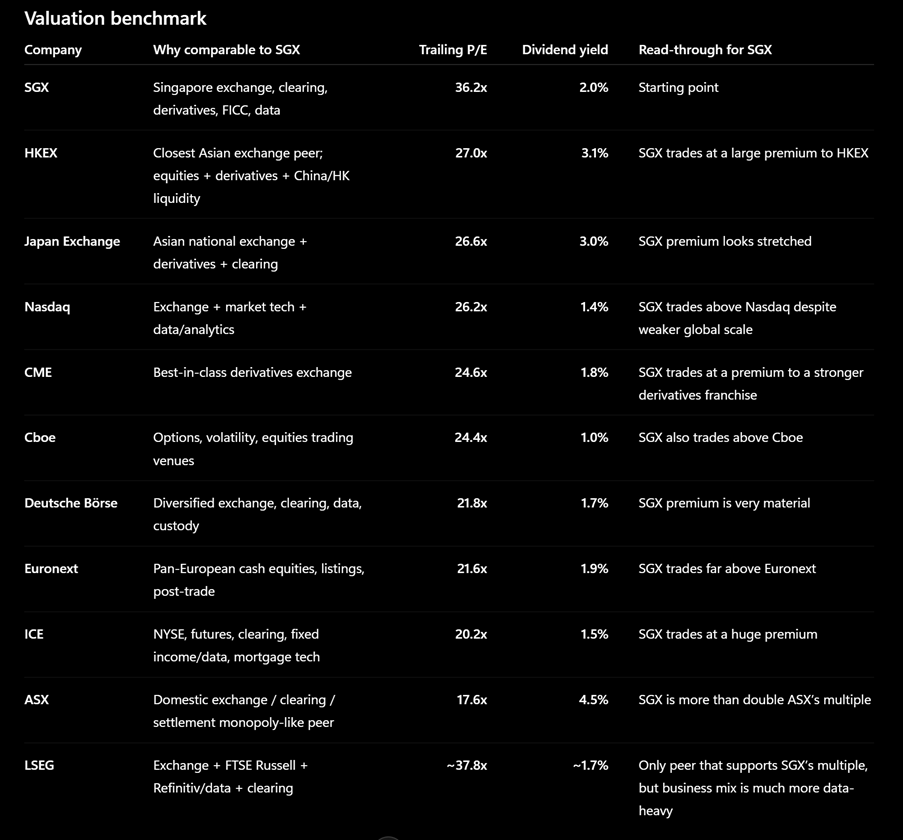
On average, the other stock exchanges trade at around 25x trailing P/E.
Based on that metric, SGX at 36x P/E is a 44% premium to other stock exchanges.
Yes, I get that SGX deserves some premium because it has:
- monopoly-like Singapore market infrastructure;
- strong cash equity trading momentum;
- growing derivatives and FICC businesses;
- policy tailwinds from Singapore market-revival measures.
But a 36x P/E means the market is already pricing in a lot of that.
SGX Shares Doubled in 2 Years — Better Buy Than DBS Bank Today?
True to the title, here’s the valuations of SGX compared vs DBS Bank:
| Metric | SGX | DBS |
| P/E | ~36x | ~16.8x |
| Dividend yield | 2.0% | 5.6% |
Fundamentally, both are in very different businesses.
SGX is a stock exchange so it’s dependent on trading volumes.
DBS is a bank so it’s dependent on interest rates, the credit cycle, and increasingly wealth management.
But the message remains that at current prices, even when you compare it to DBS (itself not cheap), SGX looks richly priced for a lot of future growth.
Note that if you look at the earnings growth though.
In the latest reported 6-month period, SGX delivered 7.6% revenue growth and 11.6% profit growth.
While DBS delivered -1.1% revenue growth and -4.2% profit growth.
So nobody is doubting that SGX’s business is performing better, the question is that to what extent has this already been priced in.
| Metric | SGX | DBS |
| Latest revenue | S$695.4m | S$11,279m |
| Prior-year comparable revenue | ~S$646.3m | S$11,410m |
| % change | +7.6% | −1.1% |
| Latest profit | S$357.1m | S$5,288m |
| Prior-year comparable profit | S$320.1m | S$5,519m |
| % change | +11.6 % | −4.2% |
Will I buy SGX stock today?
I think bottom line for me is that SGX stock today is not cheap.
At 36x trailing earnings, SGX is no longer priced as a sleepy Singapore exchange. The market is pricing it more like a high-quality, high-margin market infrastructure compounder.
For the stock to continue to outperform here, it needs to outperform against pretty optimistic expectations.
The bull case needs at least three things to be true:
- Singapore equities volumes stay strong, not just a one-off rally.
- Derivatives and FICC keep compounding, especially FX, commodities and Asian index derivatives.
- IPO/listing revival adds optionality, even though listings are still a small part of revenue.
If those happen, a 30x+ P/E can be defended and even grown.
But if growth drops back down to mid-single digits, then I would be pretty worried about the downside.
Yes, SGX has outperformed DBS, but the market is now paying more than double DBS’s P/E multiple for SGX, while accepting roughly half the dividend yield.
Looking purely at these numbers?
I’m inclined to say why not just buy the banks instead.
Yes SGX does have some diversification benefit, but if you really think about it the scenarios that are bad for the banks – say a recession, will lead to a sharp drop in SGX trading volume and hit SGX too.
If you buy SGX here, it looks more like a belief that SGX will be able to continue to grow their cash equity and equity derivatives business further – delivering against very optimistic expectations.
There I don’t have a strong view on, because who knows SGX may indeed be able to deliver on growth.
But risk-reward wise, I don’t like the numbers here.
I just find that at these valuations, I don’t make a lot even if I am right, whereas I could lose quite a bit if I am wrong.
Great business, great economic moat, and great earnings performance.
Just not a great price.
Whatever the case – my full personal portfolio, including stocks I buy/sell, are shared on FH Premium.
Love to hear what you think though!
This is an FH Premium article that I am releasing to all readers, in the hopes that it helps you in your decision making. It will not be updated going forward.
My latest macro views, as well as my full stock watch and personal portfolio, are shared on FH Premium.
Hi FH,
https://sgwealthbuilder.com/2026/06/13/sgx-share-price-to-rocket-with-nasdaq/
All eyes will be on the upcoming Global Listing Board (GLB). Will it be the holy grail that sends SGX share price into the stratosphere?
For years, Singaporean investors have shunned local stocks in favor of New York and Hong Kong, drawn by the allure of explosive capital growth and massive liquidity. The domestic exodus was exacerbated by the dearth of exciting IPOs capable of sustaining long-term retail and institutional interest. The lowest point for SGX took place in 2024 as the local bourse saw a mind-boggling zero listings on the SGX Mainboard (all 4 companies that debuted were on Catalist board).
https://sgwealthbuilder.com/2026/06/13/sgx-share-price-to-rocket-with-nasdaq/
STI is actually outperforming the S&P500 for 2 years in a row. Pretty decent actually. Question is that most of these are value stocks, and this is multiple expansion. Can this continue after 2 – 3 years of outperformance?