Okay so every year around this time, I get the same question from readers.
How to build a portfolio that generates passive dividend income?
Or more specifically – How do I get S$5,000 a month in passive dividend income?
I’ve done a version of this article every year since 2022 (last year’s one is here), so I figured it was time for the 2026 update.
The maths is the same as always – S$5,000 a month is S$60,000 a year, which is 6% on S$1 million.
But a lot has changed in a year.
The bank stocks that were paying 6% two years ago now pay about 4%.
T-bills are at 1.95%, and the latest Singapore Savings Bond pays 2.45%.
And S-REITs, which are really the only thing on the SGX still paying 6%, are sitting close to their 2023 lows.
So… can you still build a S$1 million portfolio that pays S$5,000 a month in 2026?
And more importantly – would I actually run that portfolio with my own money?
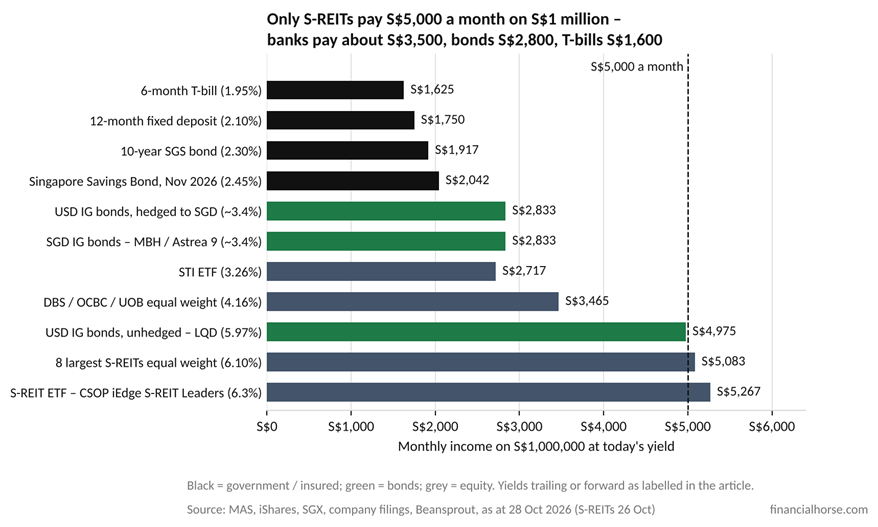
The short answer – only one thing pays 6% today
Let’s get right into it.
Long story short – there is only one asset class on the SGX that pays 6% today, and that is S-REITs.
If you spread the money across banks, REITs, bonds and cash, you get about 4.5%, which works out to roughly S$3,800 a month.
Which means that if you want S$5,000 a month without putting everything into REITs, you need closer to S$1.3 million.
Here’s the full table – arranged from risk free to highest risk.
| Instrument | Yield (as at) | Risk |
| 6-month T-bill | 1.95% | Risk free |
| 12-month fixed deposit (best) | 2.10% | Risk free up to S$100k SDIC per bank |
| Singapore Savings Bond (Nov 2026) | 2.45% 10-yr average (1.67% year 1) | Risk free |
| 10-year SGS bond | 2.30% | Principle is risk free but market price falls if interest rates go up |
| SGD investment-grade bonds (MBH ETF / Astrea 9 / bank perps) | ~3.4% | Medium risk |
| USD investment-grade bonds, hedged to SGD | ~3.4% | Medium risk |
| USD investment-grade bonds, unhedged (LQD / LQDE) | 5.97–6.09% | Medium risk |
| STI ETF | 3.26% | Equity risk |
| DBS / OCBC / UOB, equal weight | 4.16% forward | Equity risk |
| S-REIT ETF (Lion-Phillip / CSOP) | 5.9–6.3% trailing | Equity risk |
| 8 largest S-REITs, equal weight | 6.1% trailing | Equity risk |
Here’s the chart for reference.
In plain English – the one thing that pays 6% is a REIT.
Bonds – realistically 3-4% yield
I wrote about cash and bonds a few weeks back, so I’ll keep this short.
Singapore dollar investment-grade bonds pay about 3% today.
The Nikko SGD bond ETF yields about 3.2%, Astrea 9 is about 3% to call, and the new OCBC and UOB perps came in at 3% to 3.2%.
Nothing in SGD that is investment grade comes anywhere close to 6%.
The only investment-grade bonds paying 6% are US dollar corporate bonds – something like LQD or PIMCO GIS Income Fund yields just under 6%.
Sounds great right?
The problem is that you’re taking on 7.6 years of duration risk, plus currency risk on top.
And if interest rates go up, you’re looking at a mark to market loss (for reference this fund lost 18% in 2022).
Which is a big problem now as interest rates have been marching up due to the Iran war.
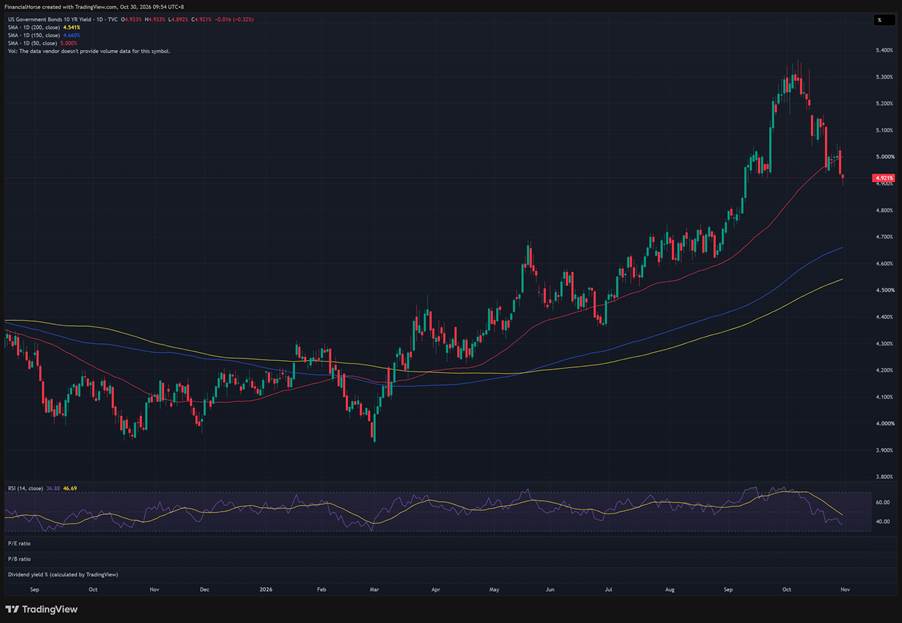
And if you hedge the currency risk away, the 6% becomes about 3.4%, because US short-term rates are at 4% while SORA is at 1.3%, and you pay that difference to hedge.
In plain English – a hedged US bond pays what a Singapore bond pays, with more interest rate risk.
Which leaves the “6% income funds” that get sold to retirees.
I’ll just say that some of the popular ones are paying out more than they are earning this year, and some of them have duration risk in that when interest rates go up, there is a mark to market loss – exactly what we’ve seen this year.
Long story short – bond funds are riskier than T-Bills, but probably still lower risk than stocks or REITs.
They’re definitely an option, but in today’s market bonds realistically pay about 3-4% yield (assuming you don’t want to take a lot of risk), and won’t hit the 6% target.
Never miss a post! Follow Financial Horse on WhatsApp or Telegram — one tap, and every new article reaches you the moment it’s published.
Singapore Banks – 6% dividend yield no more
Remember when the Singapore banks yielded 6%?
In August 2024 all three banks paid about 6%, and in last November’s version of this article UOB at 6% and OCBC at 5.7% were the core of the portfolio.
A year on – OCBC is up 72%, DBS is up 38% and UOB is up 19%.
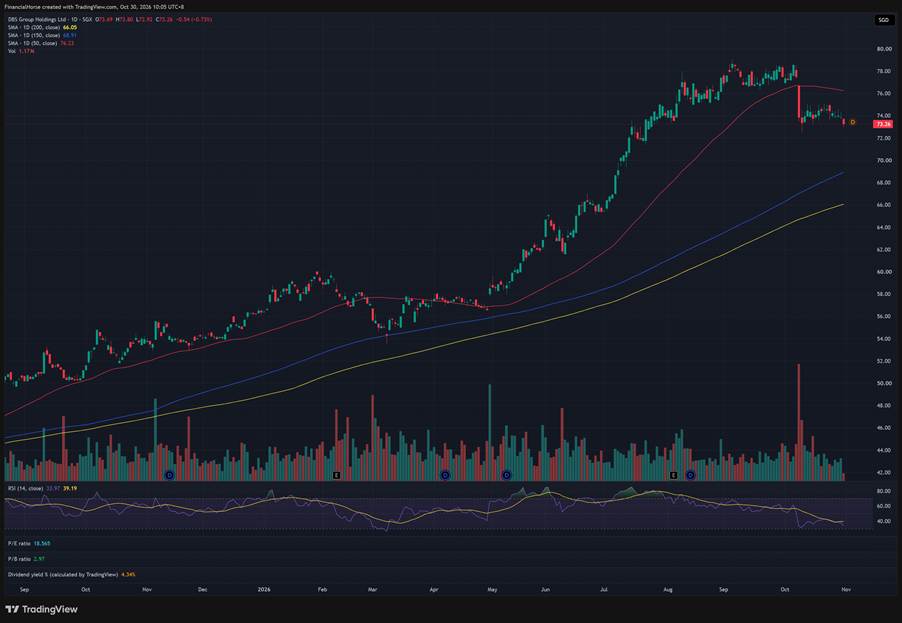
The dividends haven’t really moved – but the price has.
So at today’s prices DBS yields 4.4%, UOB 4.2% and OCBC 3.9%.
And frankly even those numbers flatter a bit.
DBS’s 15 cent capital return is only scheduled until FY2027, so strip it out and DBS is a 3.6% yield.
UOB cut its regular dividend 13% for FY2025.
And OCBC’s capital is already at its 14% target, so the special dividends stop once the current S$2.5 billion plan is done.
Even after the sell-off earlier this month, where the three fell 6% to 10% in two days, they are still 4% stocks.
For the banks to get back to a 6% yield on today’s dividends, DBS would need to fall to S$54, OCBC to S$18.70 and UOB to S$29.30.
That’s a 27% to 36% drop.
You can see it in the chart below.
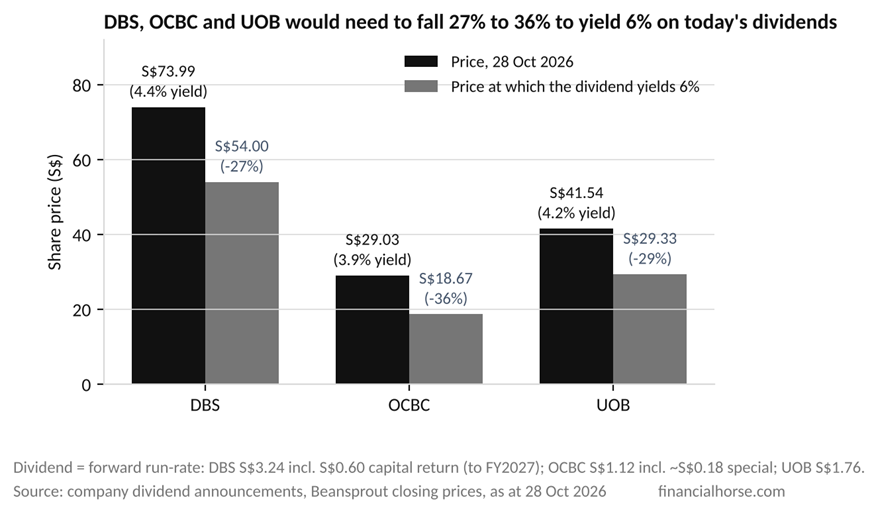
The market has basically decided that the banks are growth stocks and the REITs are the problem.
So a Singapore bank today is a stock that happens to pay 4%, not a 6% income play – which is fine, but it means the banks can no longer carry the 6% dividend yield for you.
S-REITs – the only 6% dividend play
Which brings us to the one asset class that still pays 6%.
The S-REIT sector yields about 6.3% on average.
That’s about 4 points above the 10-year Singapore government bond, against a long-run average of 3 to 3.5 points.
The sector trades at 0.77x book, against a 10-year average of about 1x.
And the REIT index as a whole sits below its COVID lows – which is pretty nuts when you think about it.
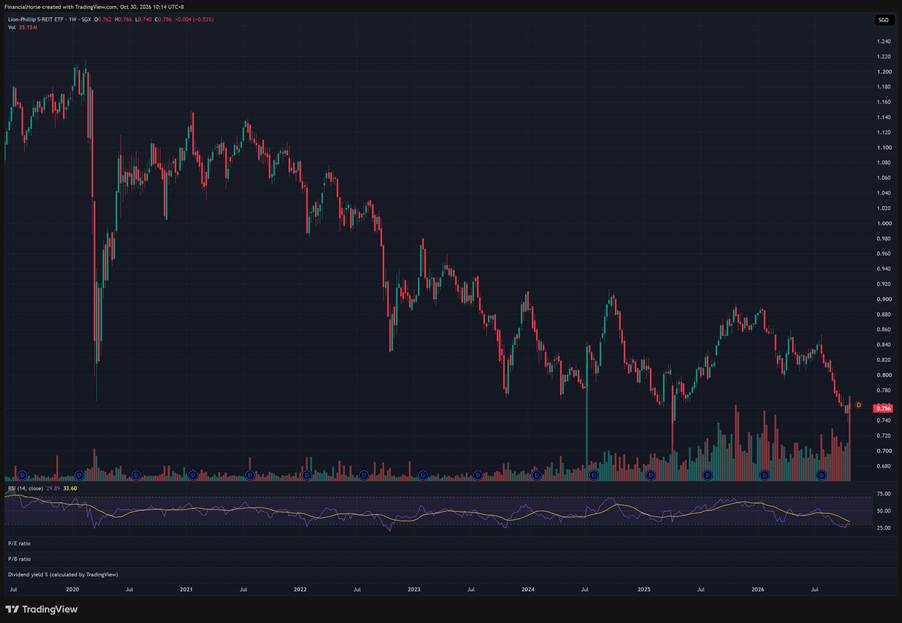
So on every measure, S-REITs are cheap against their own history – the point I made back in September.
But there is cheap, and there is also falling knife.
So which is this?
I’ve compiled the dividend yield for the 8 largest S-REITs, and their DPU direction below:
| REIT | Dividend yield | DPU since FY2021 |
| CICT | 5.2% | Up every year |
| Keppel DC REIT | 5.4% | Up since FY2023 |
| Frasers Centrepoint Trust | 5.6% | Flat |
| Suntec REIT | 5.6% | Recovering from a 30% cut |
| Mapletree Logistics Trust | 6.6% | Down 2 years |
| Ascendas REIT | 6.7% | Flat to down |
| Mapletree Pan Asia Commercial | 6.8% | Down |
| Mapletree Industrial Trust | 6.9% | Down |
You see the problem?
The 4 REITs where the DPU is still growing – CICT, Keppel DC, Frasers Centrepoint, Suntec – average about 5.5%.
The 4 REITs paying 6.5% to 7% – Ascendas, Mapletree Pan Asia, Mapletree Logistics, Mapletree Industrial – all have DPU that is flat or going down.
So the extra yield% is not free money.
It is the market telling you it expects the dividend to keep shrinking.
Mapletree Industrial Trust is the perfect example.
7% yield, 47% off its highs, and the DPU fell another 6.6% last quarter because its US data centres are only 79% occupied.
A 7% yield doesn’t fix that.
And it gets worse further down the list – ESR-REIT at 12%, CDL Hospitality at 7%, CapitaLand Ascott at 7% – gearing of 35% to 41%, interest cover of 2 to 3 times, and DPU 10% to 30% below its peak.
That’s the yield trap zone.
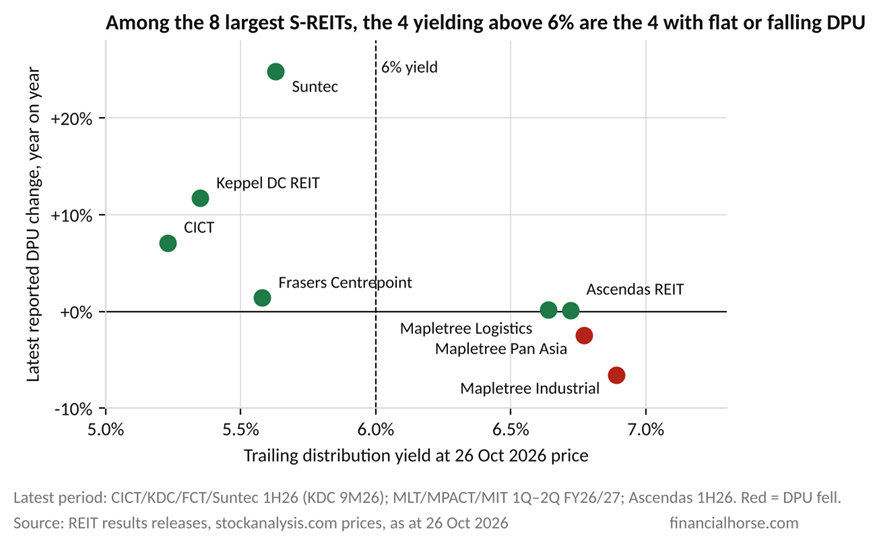
In plain English – the higher the yield on an S-REIT today, the worse the dividend trend.
So yes, you can build the 6% portfolio from the 8 largest REITs, and on paper you get S$5,083 a month.
But there is real risk here.
If the 4 high yielders cut DPU another 5%, you’re at S$4,920.
If they cut 15%, which is what Mapletree Industrial has done from its peak, you’re at S$4,660.
What actually moves the REIT price – and when it turns
To be fair to the REITs, the income is not really the problem this year.
SORA is at 1.3%, the blue chips borrow at around 3% with most of their debt hedged, and refinancing is actually a tailwind right now.
The price has fallen because long-term interest rates went up.
The US 10-year went from 4.2% to 5% this year, the Fed hiked in September, and at this week’s meeting 2 members voted for another hike – the market has a December hike mostly priced in.
So REIT prices have not fallen because rents fell.
They’ve fallen because the risk-free rate they get measured against went up.
The last time this happened was 2022.
The 10-year Singapore bond peaked at 3.6% in October 2022, and the REIT index kept falling for another 13 months, bottoming 19% lower in November 2023.
The long end turns first, and the REITs follow with a lag.
There’s 2 ways of seeing this.
Either a 5% US 10-year is the new normal, and S-REITs stay 6% to 7% yield products with slowly shrinking dividends.
Or the long end has peaked, and a sector at 0.77x book is in for one hell of a recovery.
If you ask me – REITs are a decent yield play at these prices, and a mean reversion play once interest rates come down.
But it’s hard to call exactly when interest rates turn lower, and until they do, the sector looks like a falling knife.
So what does a S$1 million portfolio actually get you?
With all that in mind, here are the 3 ways I would think about running S$1 million for income today.
Portfolio A – the 6% portfolio. 100% S-REITs, the 8 largest equal weighted (or just buy the S-REIT ETF).
That gets you 6.1%, or S$5,083 a month – and it is the only way to the number.
The price risk is the one I write about every year – a 20% fall in the REIT index wipes out more than 3 years of dividend income.
And the income risk is the table above – the 6% comes from the 4 names whose dividends are going down.
You’re basically putting $1 million into a falling knife – and hoping that this is the bottom.
Sure maybe it is – but maybe it isn’t too.
Portfolio B – the diversified income portfolio. 40% S-REITs, 30% banks, 15% SGD investment-grade bonds, 15% T-bills and Singapore Savings Bonds.
That pays about 4.5%, or S$3,770 a month.
The REITs still do most of the work, the banks give you some dividend growth, and the bonds and cash are there for when the REIT index drops 20% again.
You’re basically accepting a lower yield in exchange for the diversification.
To get S$5,000 a month from this, you need S$1.33 million.
Portfolio C – the total return portfolio. Not a dividend portfolio at all – a mix of stocks and bonds that you draw 3% to 4% from, the way I set out in the 4% rule piece in July.
That needs S$1.5 to S$2 million for S$60,000 a year, unless you’re prepared to sell some stocks to realise the “yield”.
Sounds worse, until you remember that CPF LIFE at the Full Retirement Sum pays about S$1,780 a month from 65.
So after 65, the S$1 million only needs to supply about S$3,200 a month, and you can make up the rest using CPF LIFE.
One more thing on the 6% – inflation.
At 2.2% inflation, S$5,000 a month buys you S$4,000 of today’s money in 10 years, and S$3,200 in 20.
A flat 6% yield is a shrinking real income – whereas a 4% yield that grows 5% a year pays you more than a flat 6% from year 10 onwards.
Long story short – S$1 million can pay S$5,000 a month in 2026, but only if the whole S$1 million goes into S-REITs, bought while the sector is a falling knife, with the yield sitting in the names whose dividends are falling.
That’s the same answer I’ve given every year since 2022.
The difference in 2026 is that because the bank stocks have gone up so much – their dividend yield can no longer carry the portfolio at current prices.
What I’m doing with my money
I think the discussion above has made it clear what is the problem.
Bank stocks have gone up a lot, to the point where they only pay a 4% dividend yield today.
While the only asset class that can realistically hit a 6% dividend yield, is a falling knife at the moment, and DPU is flat / negative.
Sure you can consider other instruments like US Treasuries which pay 5% risk free today, but that means a USD FX exposure, as well as mark to market loss if interest rates go up. Hedge that USD FX exposure away and you’re looking at 3% yield, so there truly is no free lunch in this world.
So… what’s a dividend investor to do in a market like that.
In my view there are 2 options.
One is that you simply accept a lower yield.
Accept that in this market, realistically you can only get 4-5% yield, and try to make that work.
Two is that you accept higher risk.
You go out the risk curve, deliberately take on more risk in exchange for the 6% yield.
But risk goes both ways, and it may backfire in the form of capital loss.
Now what would I do?
Personally my own income sleeve looks a lot more like Portfolio B than Portfolio A.
I hold a handful of Singapore REITs focussing mainly on the large caps with primarily Singapore real estate.
And I also hold meaningful exposure to the Singapore banks.
But on top of the yield instruments, I also hold US tech stocks, gold, bitcoin – stuff that can deliver on growth and capital gains apart from yield.
Because if I am right and this decade is an inflationary one, then just holding a yield portfolio becomes pretty dangerous – you need stuff that can hedge against monetary debasement.
That being said, markets move quickly, and if the facts change, I’ll change my mind and buy / sell positions based on how market conditions change.
You can see my full personal portfolio on FH Premium, together with weekly updates on what I buy / sell.
Love to hear what you think!
This article was written on 29 Oct 2026. It will not be updated going forward.
How my own portfolio is actually positioned — with weekly updates on what I buy and sell — is shared on FH Premium, alongside my full stock watchlist and the prices at which I would buy.
Join the FH mailing list and new articles land straight in your inbox:
Also on WhatsApp, Telegram and Facebook.